Ghanesh RS
Product Designer · AI · Enterprise SaaS · 10+ Years Experience
Experience
Jisr
HR & Spend Management
Eightfold AI
AI Talent Intelligence Platform
ThoughtSpot
Analytics & Business Intelligence
Freshworks
Project Management & CRM

Eightfold AI · Career Hub
How we grew Career Hub engagement by reimagining a forgotten feature
Ghanesh RS · Principal Product Designer
Setting expectations
Three things before I walk through the work
This was the MVP
Everything I show is what actually shipped, not a concept.
Scale was a real constraint
10,000+ employee orgs shaped the design, genuinely, not as an excuse.
There's a roadmap
I'll flag shipped vs. fast-follow vs. long-term vision as we go.
My role
Lead Product Designer, strategy through spec, end to end
Owned
Discovery research → interaction design → prototyping → validation → engineering handoff
Partnered with
PM, UX research, content design, engineering
Systems reach
Drove adoption with the Design Systems team so patterns could scale beyond this feature
Understanding Career Hub
One destination for growth, learning, jobs, mentors, and people
Org Chart was one part of that ecosystem, but it had far more potential than it was delivering.
1Learning & skill goals
2Internal jobs
3Mentoring
4Career paths
5Org Chart, today's focus
Business opportunity
Two bets to grow engagement. I designed both, in parallel.
Bet A · Build something new
Kudos
Peer recognition inside Career Hub. Thank a colleague with a badge. Better morale and motivation bring people back.
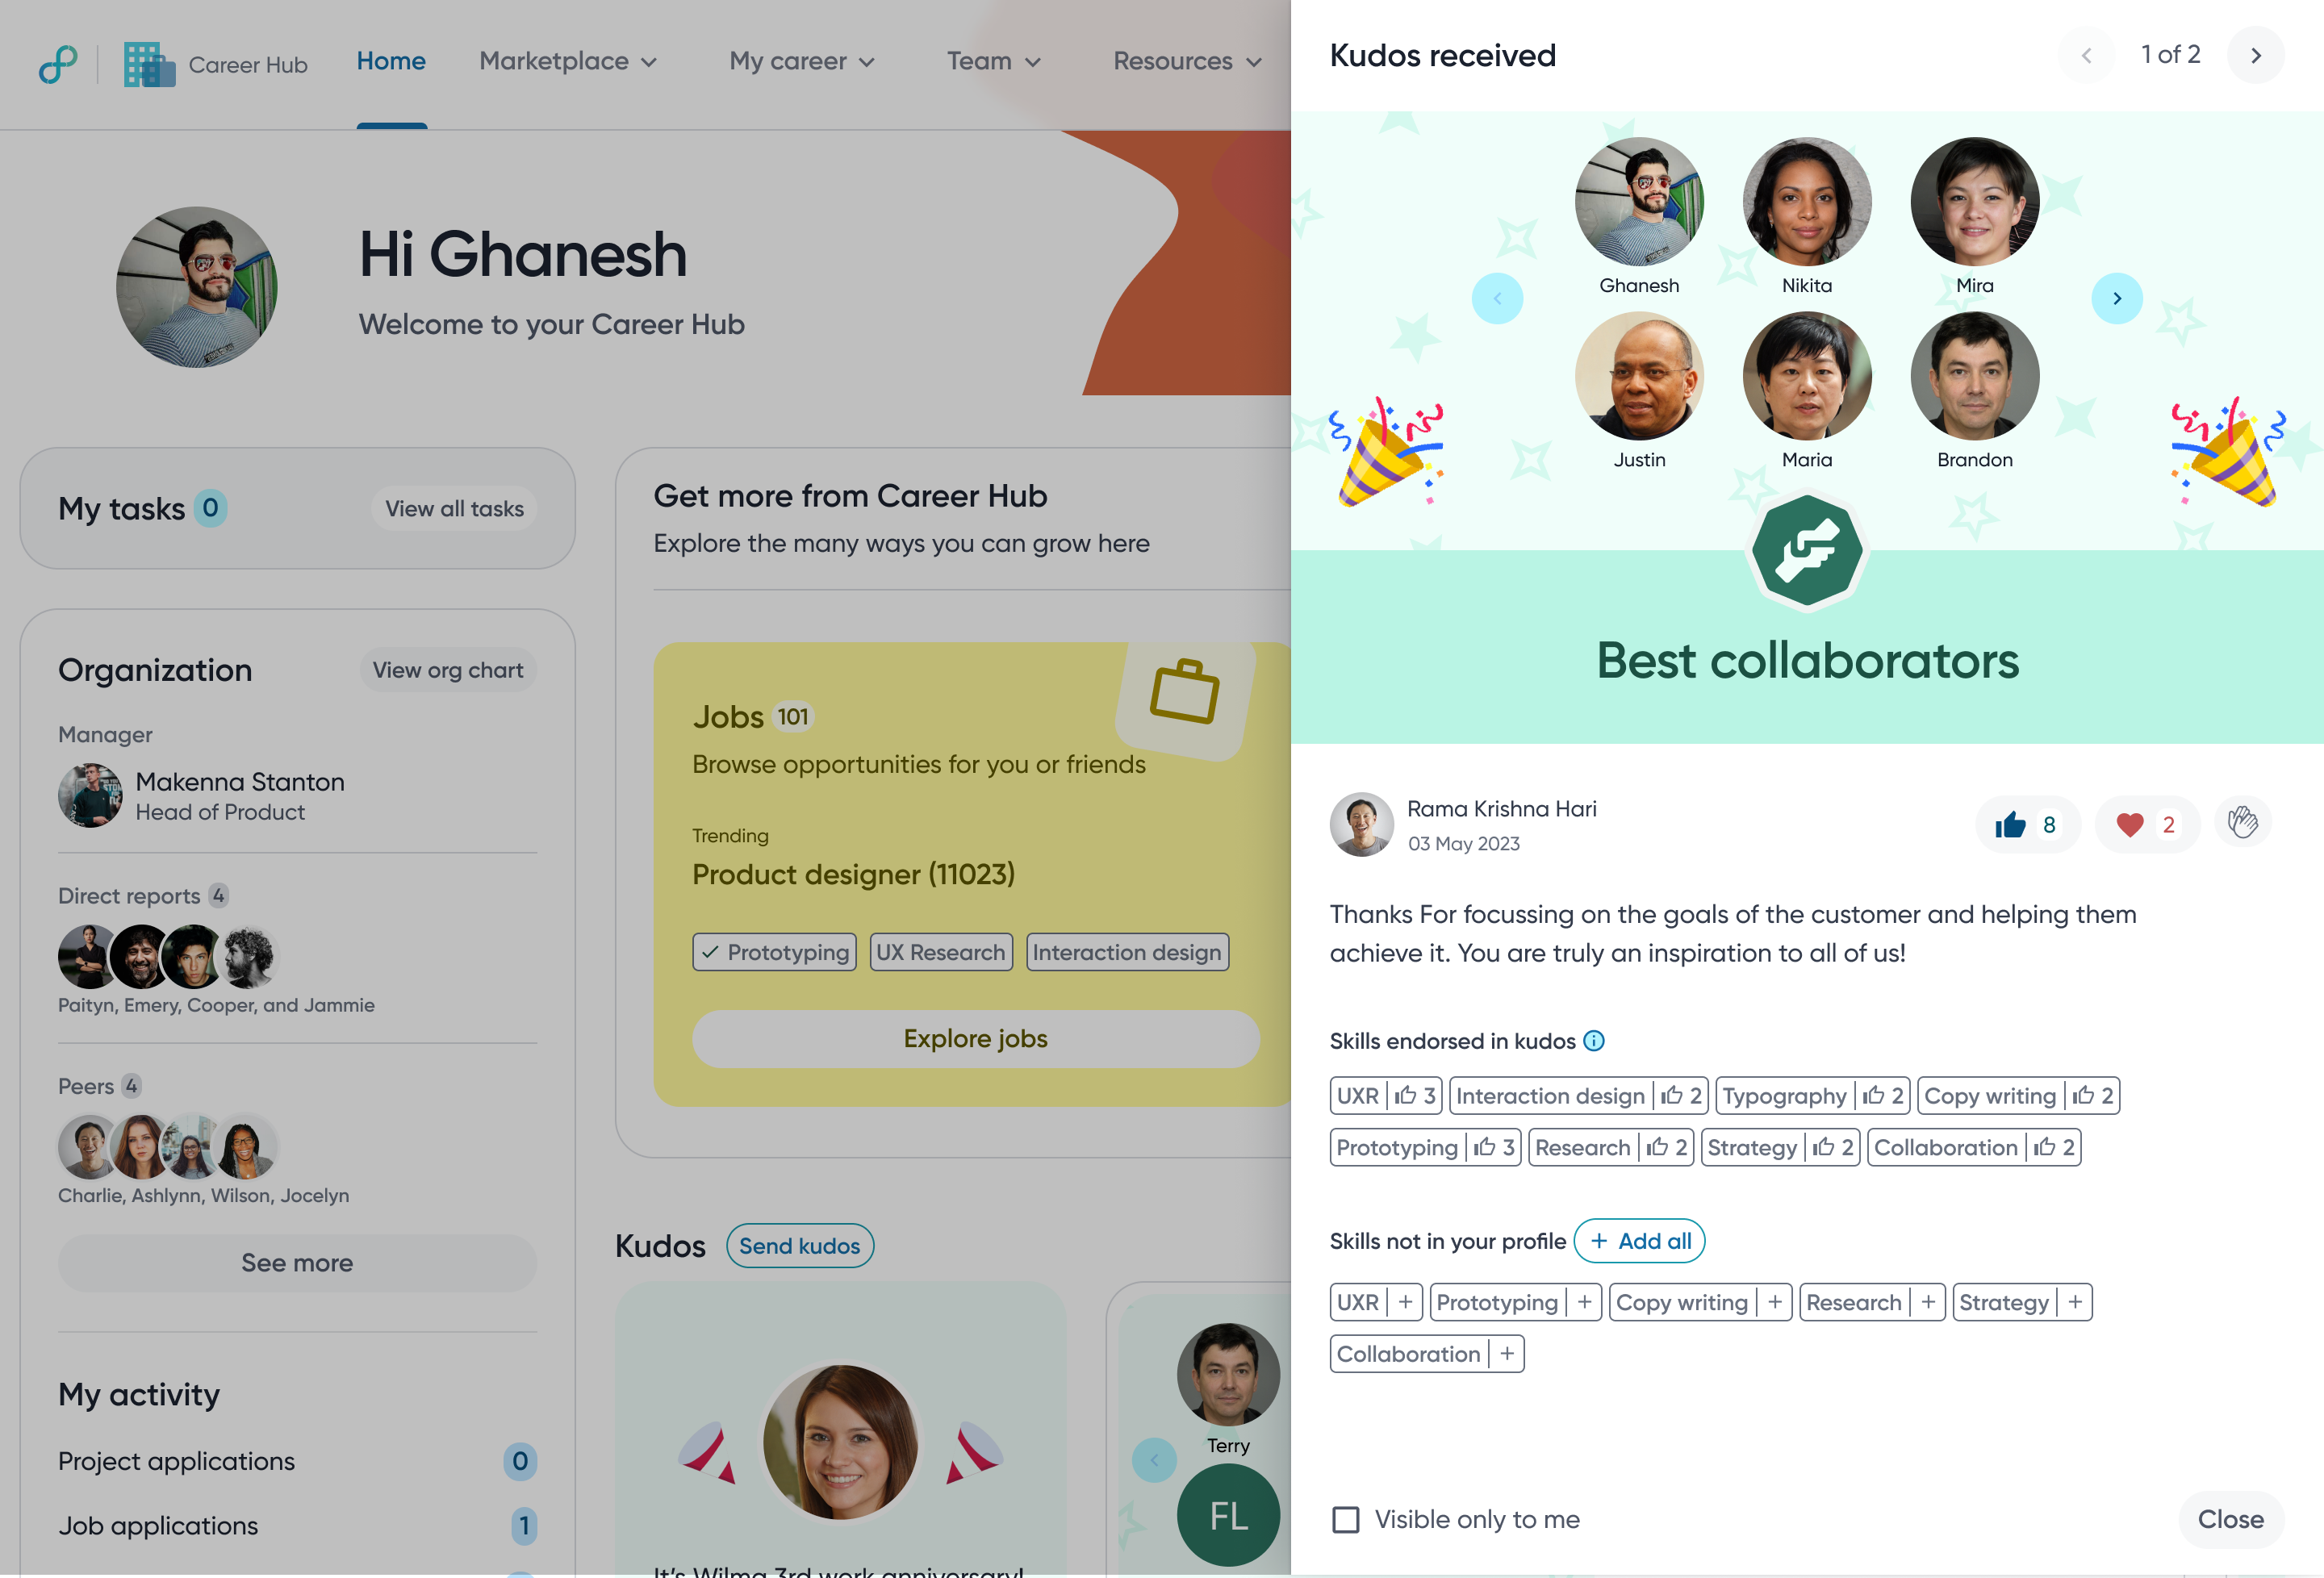
Did not ship. Its UI patterns went into the design system.
Bet B · Reimagine what exists
Org Chart
People already knew it. Strong intent, poor experience. A faster path to engagement.
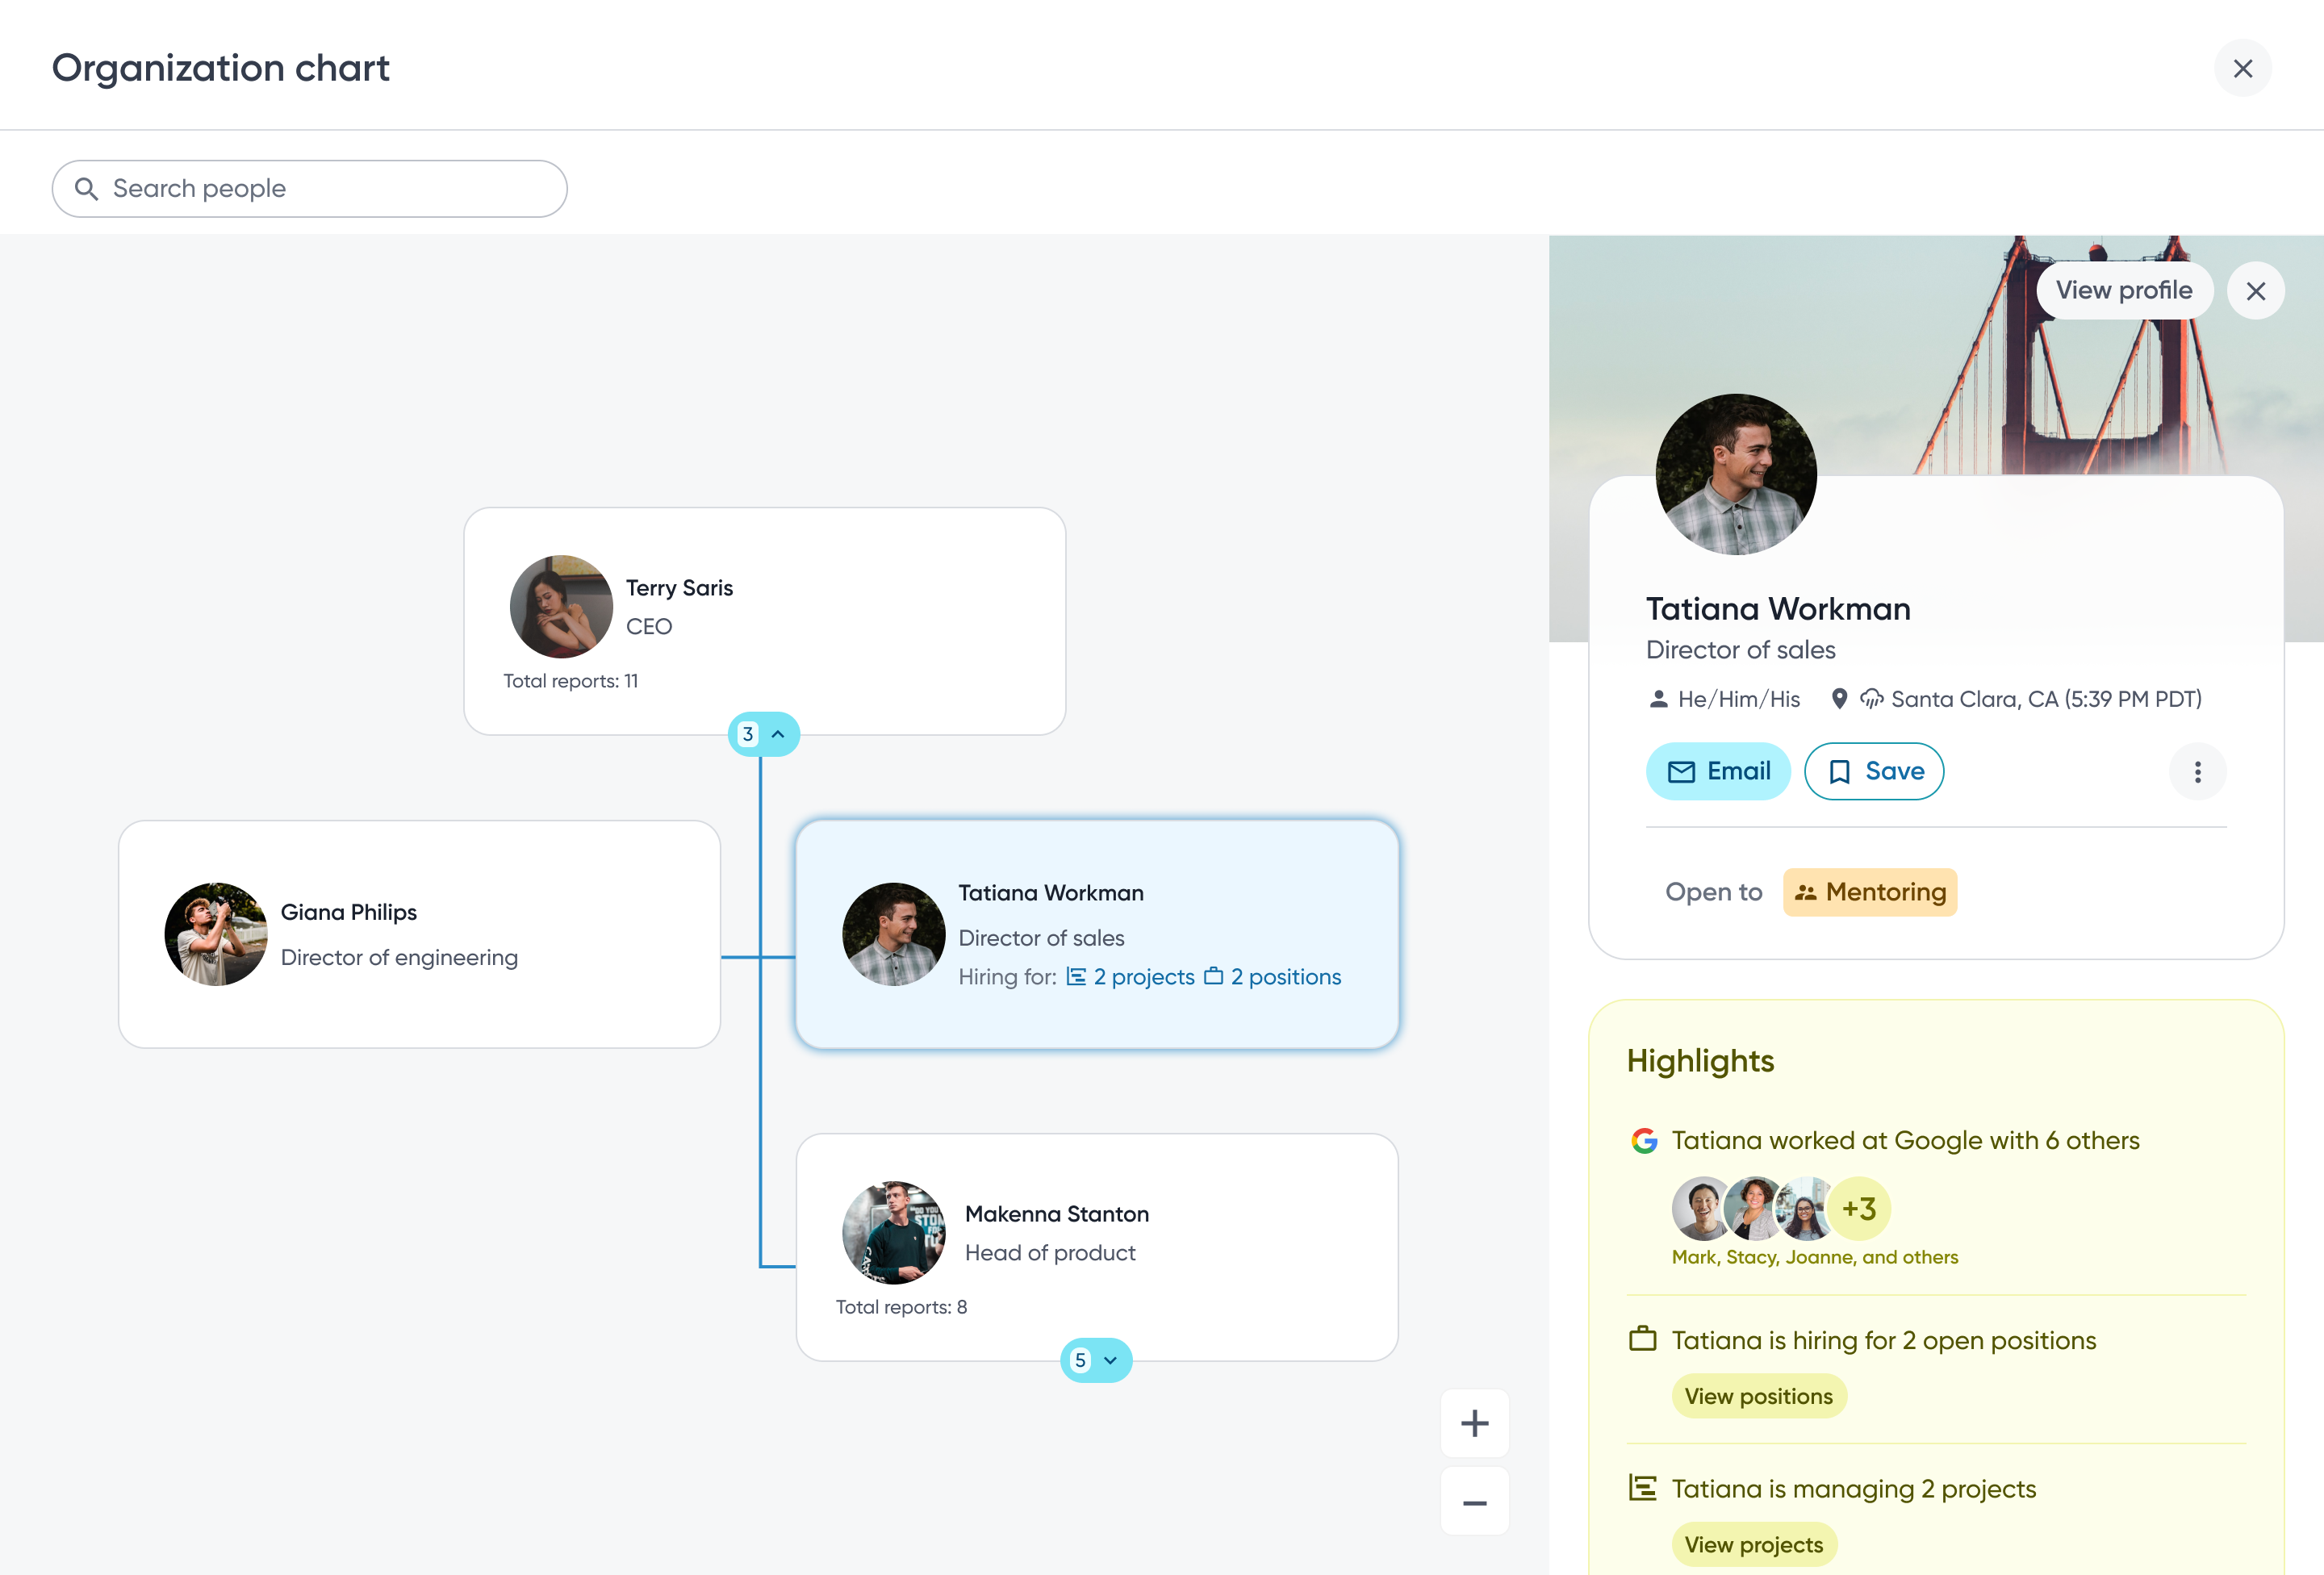
Shipped. This is today's story.
How we framed the opportunity
Could Org Chart become the navigation layer that connects people, opportunity, and growth?
The opportunity wasn't redesigning an Org Chart, it was transforming an underutilized feature into an entry point for employee discovery.
The existing experience
A hackathon project, buried three clicks deep
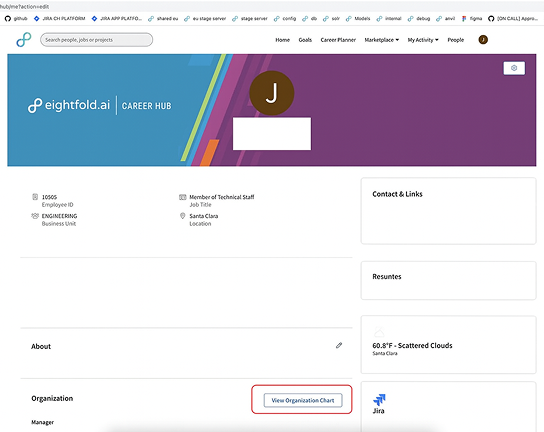
1. Buried in the Profile
A small text link, easy to miss and disconnected from context.
→
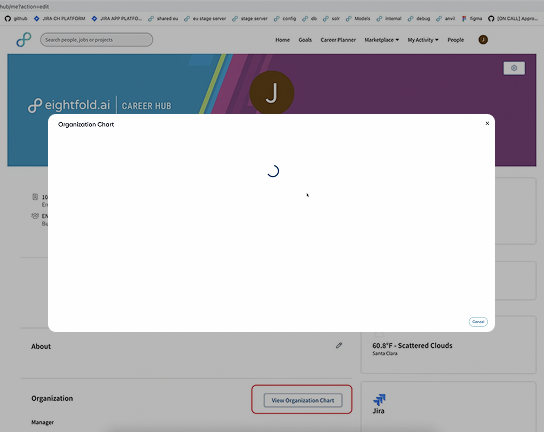
2. A popup, and a wait
Every click opened a new modal and a fresh loading spinner.
→
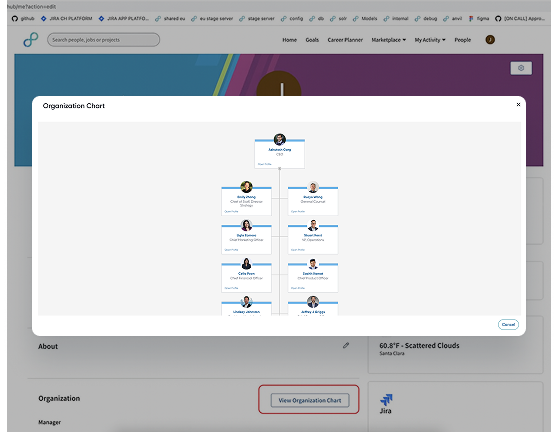
3. Shallow, dismissable, dead-end
No search, little context, and one click away from disappearing.
In practice
Every click interrupted the flow
The interaction model, not the visual design, was what kept the Org Chart from delivering the value employees expected from Career Hub.
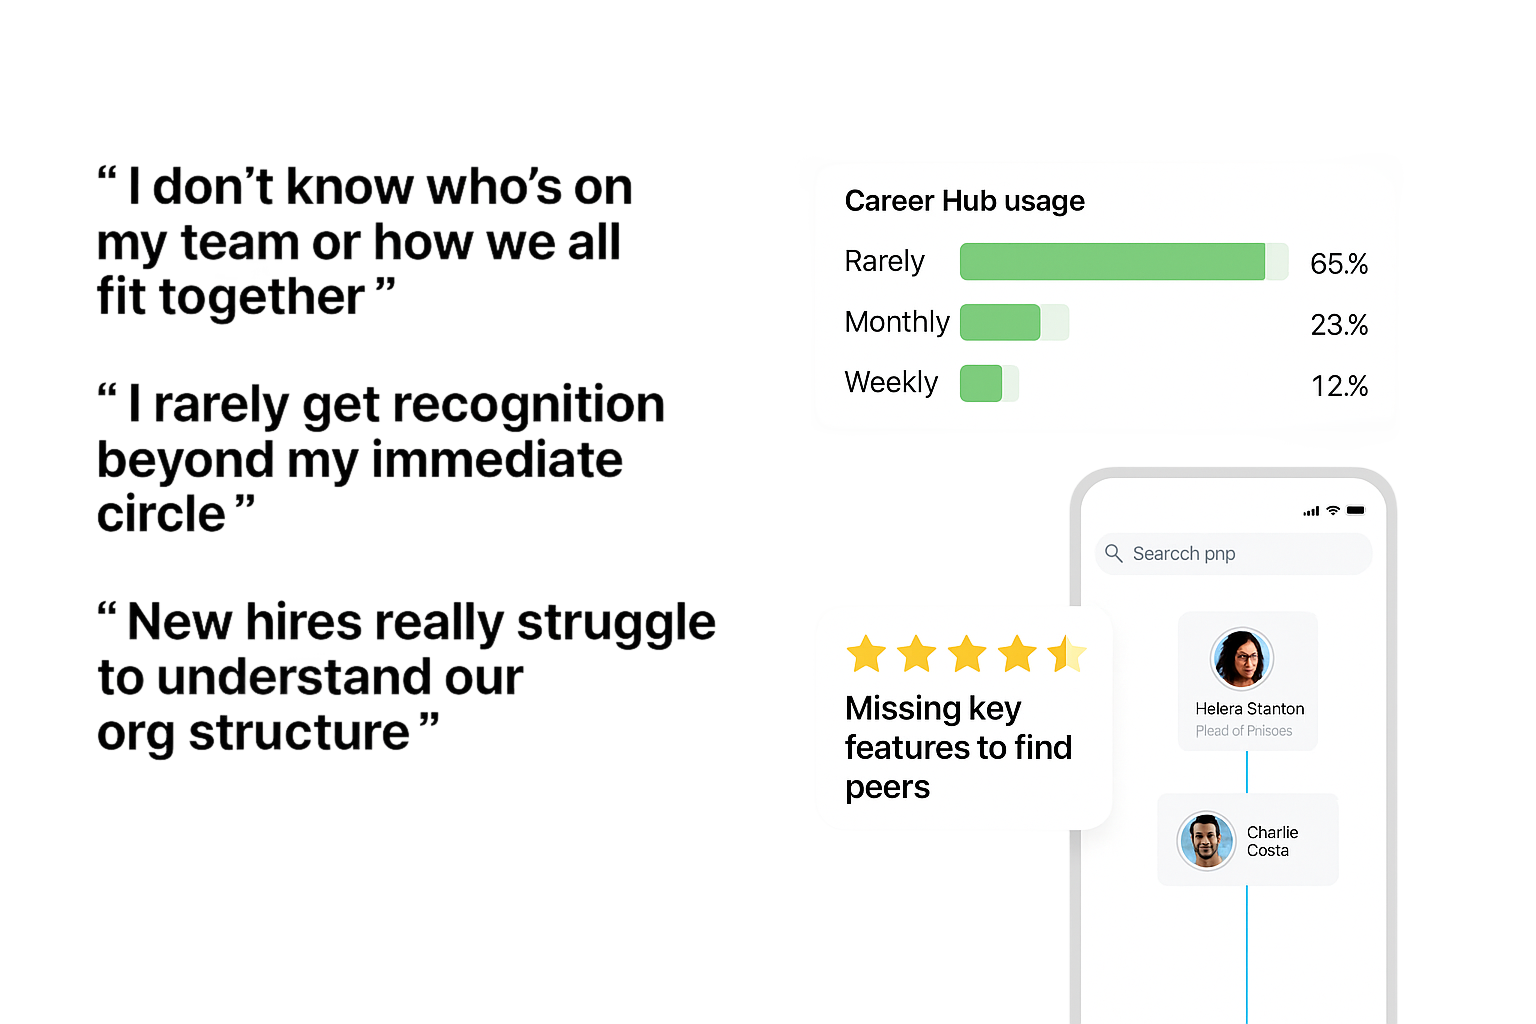
AUDIENCE & KEY RESEARCH INSIGHTS
Different goals, shared challenges
Employees
Connect with peers, understand team structure, simple & intuitive UI
Managers
Team insights at a glance, easy org updates, customizable views
EXPLORING INTERACTION MODELS
Popup, sliding panel, or full screen?
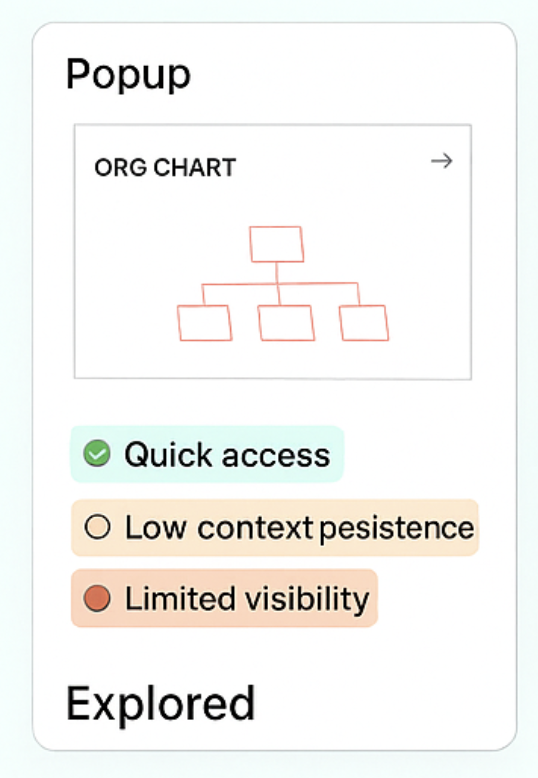
Popup
✅ Familiar
❌ Easy to dismiss
❌ Limited context
❌ Limited context
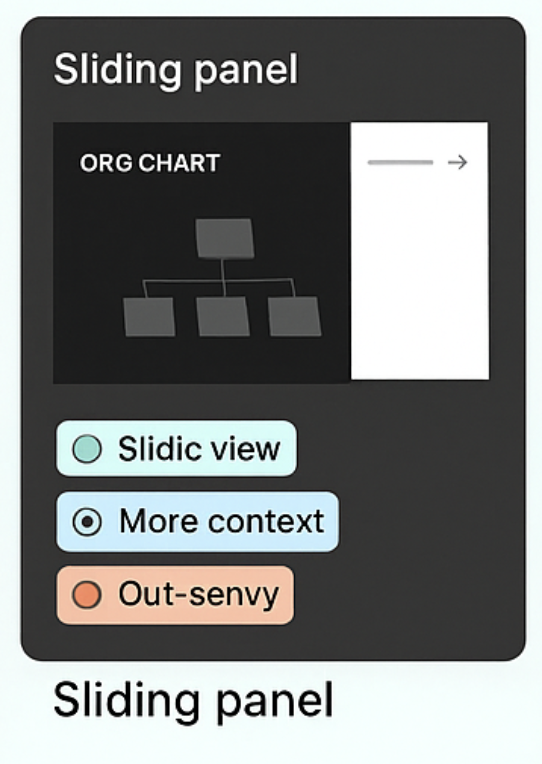
Sliding panel
✅ Preserves context
❌ Limited space
❌ Difficult for deep hierarchies
❌ Difficult for deep hierarchies
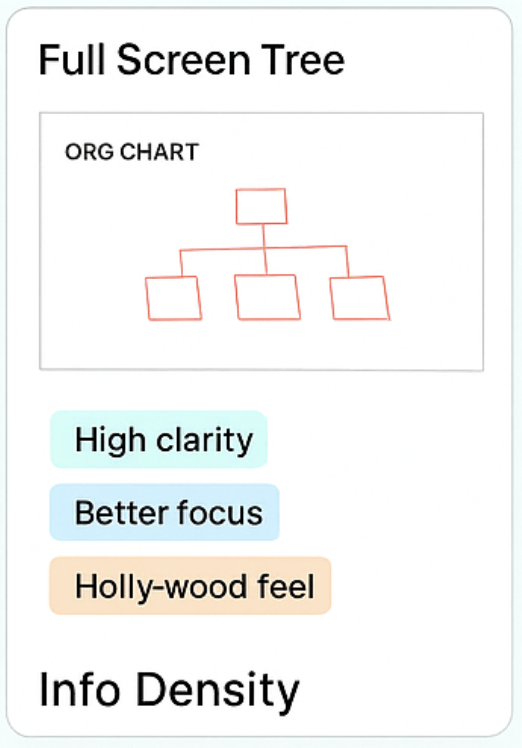
Full screen
SELECTED
✅ Immersive
✅ Scales better
✅ Supports future workflows
✅ Scales better
✅ Supports future workflows
Cross-functional trade-offs
Feedback from Initial explorations
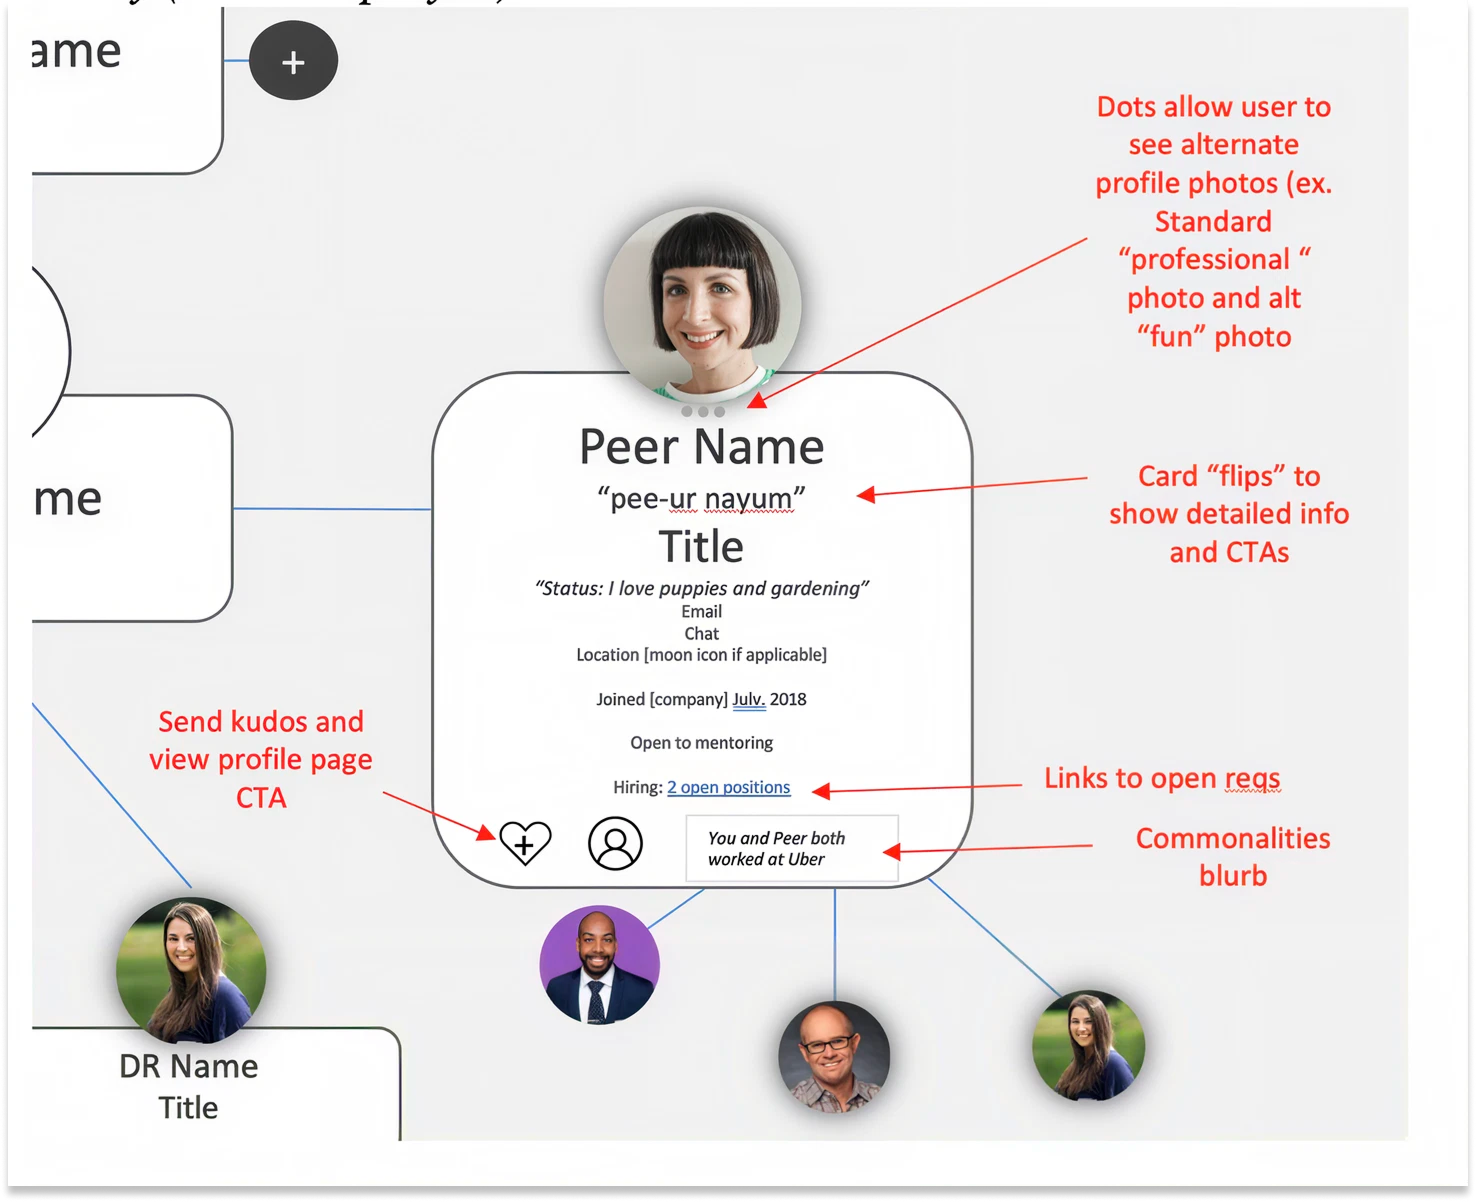
Initial concept
Rich detail on every node
↓
TECHNICAL CONSTRAINTS
Performance
Large datasets
API complexity
Large datasets
API complexity
↓
Key insight
Move detail out of the tree, not out of the experience.
INITIAL CONCEPT (BRD)
Designing for enterprise scale
Turning a Product-vs-Engineering standoff into five shared principles
Cross-functional review
→
Enterprise constraints
→
Five design principles
Performance
Progressive disclosure
Context preservation
Discoverability
Accessibility
Translating vision into design principles
Five principles that guided every decision
Discoverability
Meet users where they are
Context
Never lose your place
Progressive disclosure
Reveal detail on demand
Scalability
Support enterprise organizations
Reusability
Build patterns, not pages
Decision framework used throughout the project.
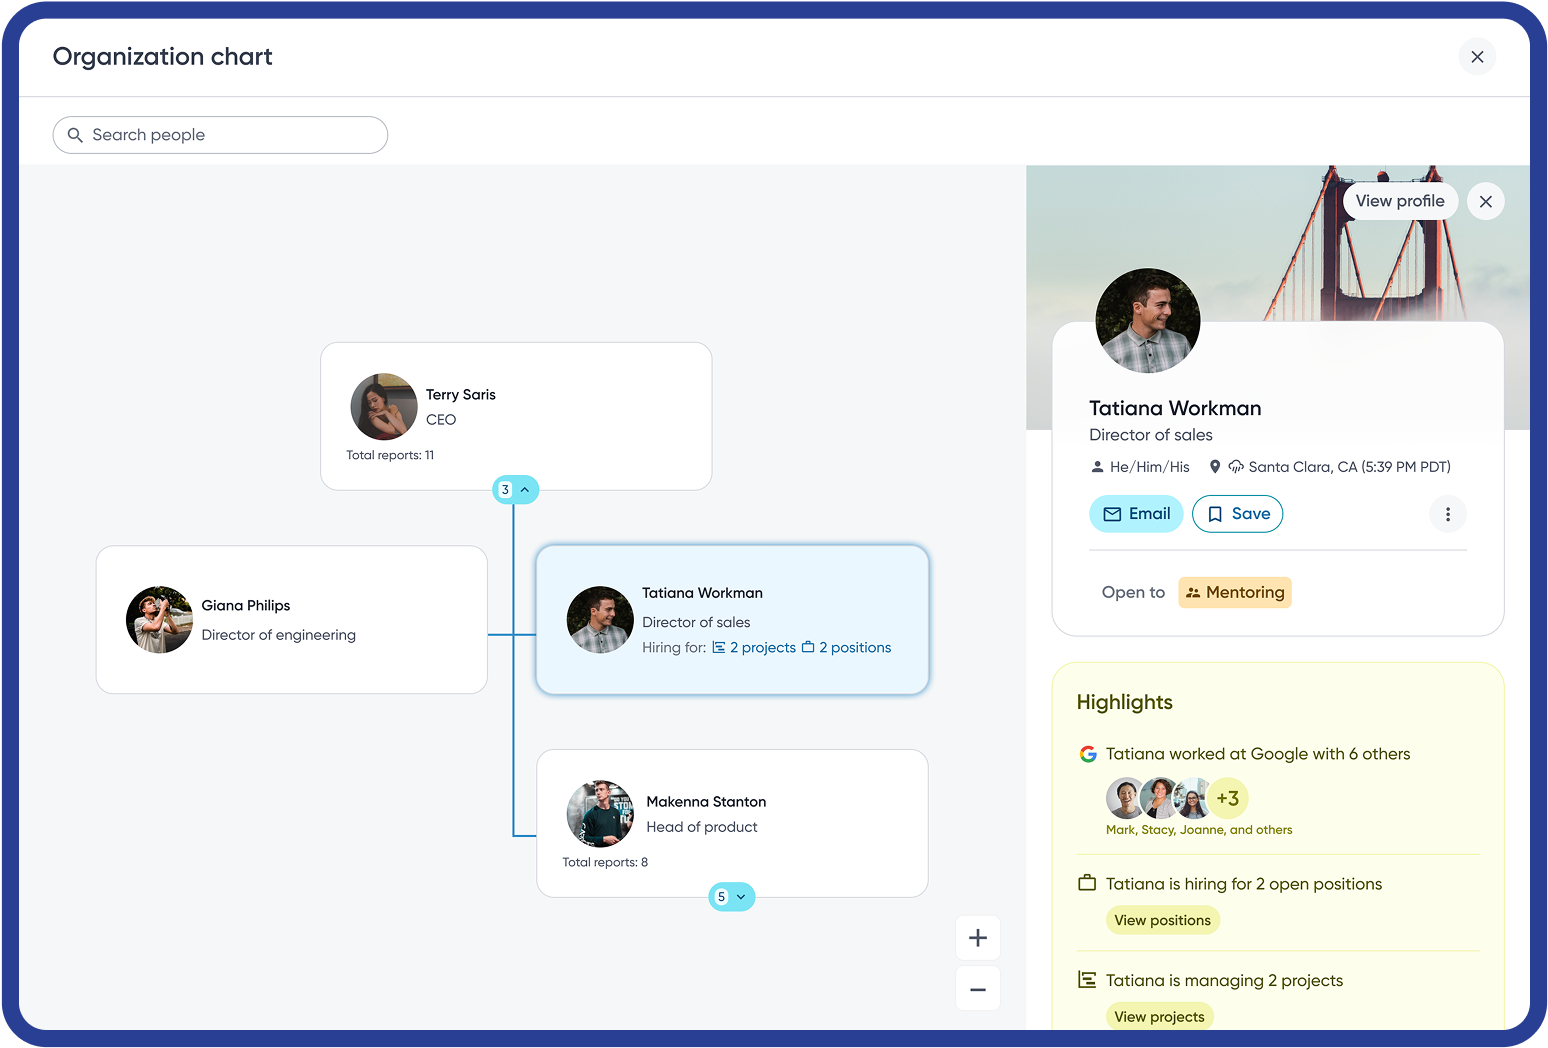
The redesigned experience
From default view to rich context, in one click
Default view
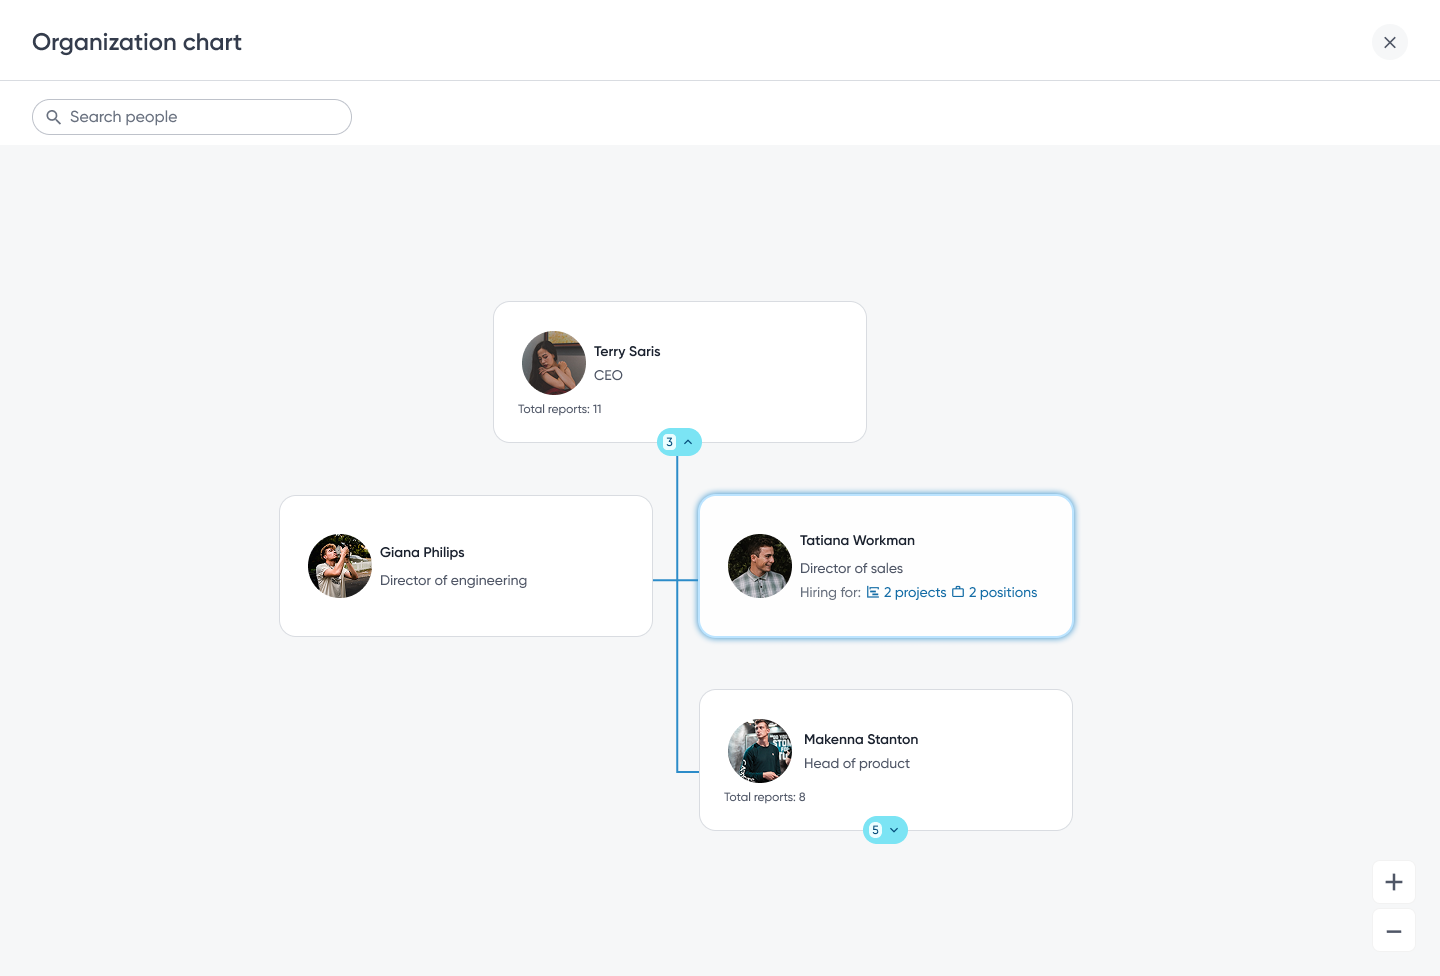
Mini Profile expanded
WHY IT WORKS
Clarity without sacrificing capability
Three levels of hierarchy by default, deeper context only on demand.
1
Full screen
Room for big orgs. No popup to close by mistake.
2
Search
Jump straight to anyone.
3
Three levels by default
Enough context, no clutter.
4
Expand or collapse
Open a team only when you need it.
5
Selected highlight
You always see where you are.
6
Mini profile
Details beside the chart. You never lose your place.
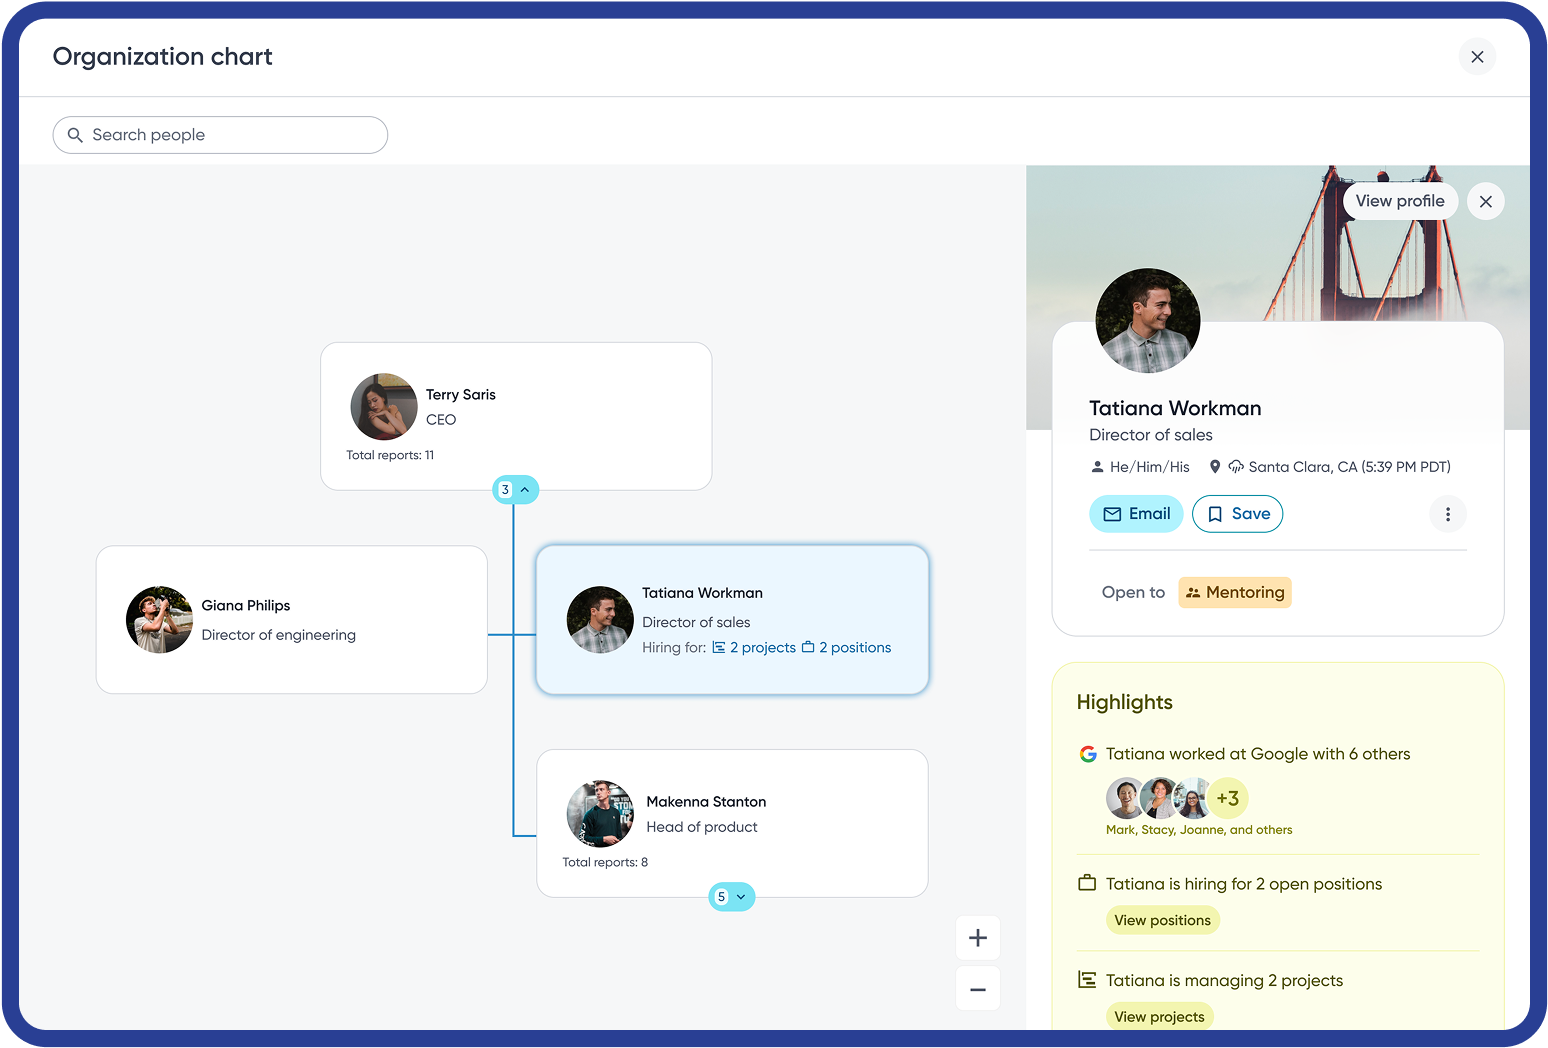
The breakthrough
Rich employee context without leaving the hierarchy
Rich employee details appear instantly while the hierarchy remains visible, making exploration continuous instead of disruptive.
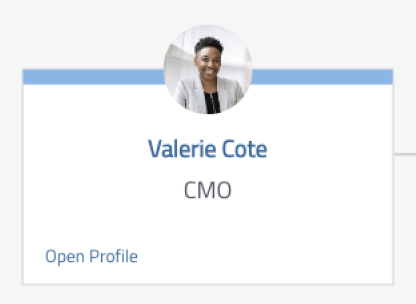
Improving discoverability
Meeting users where they already were
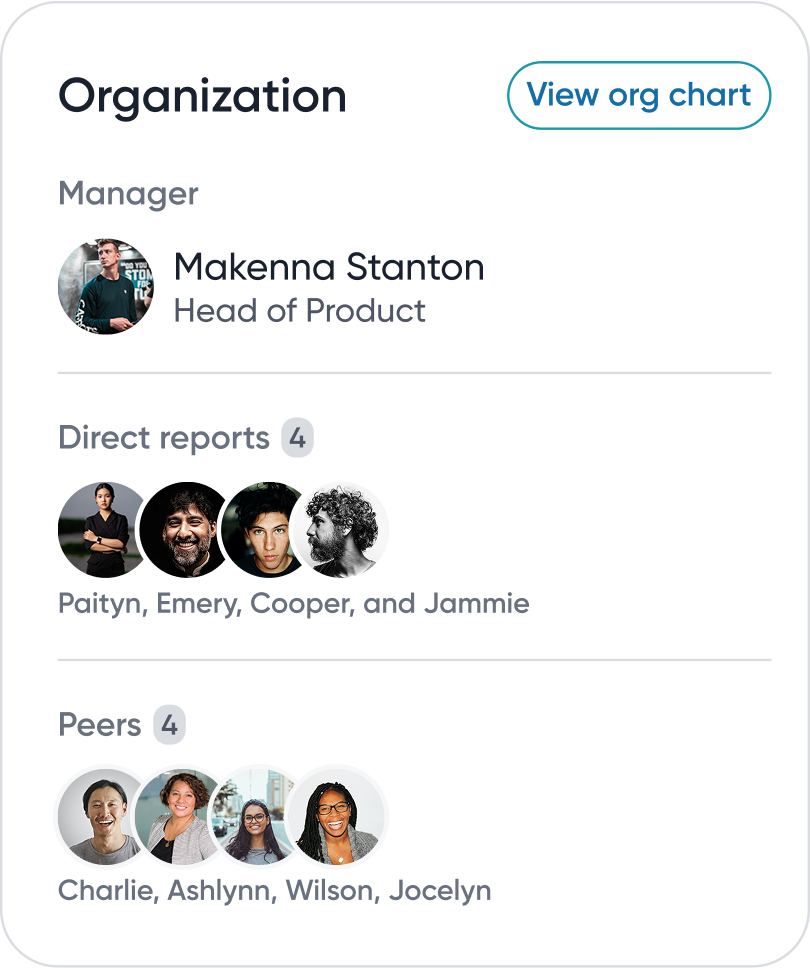
Profile widget
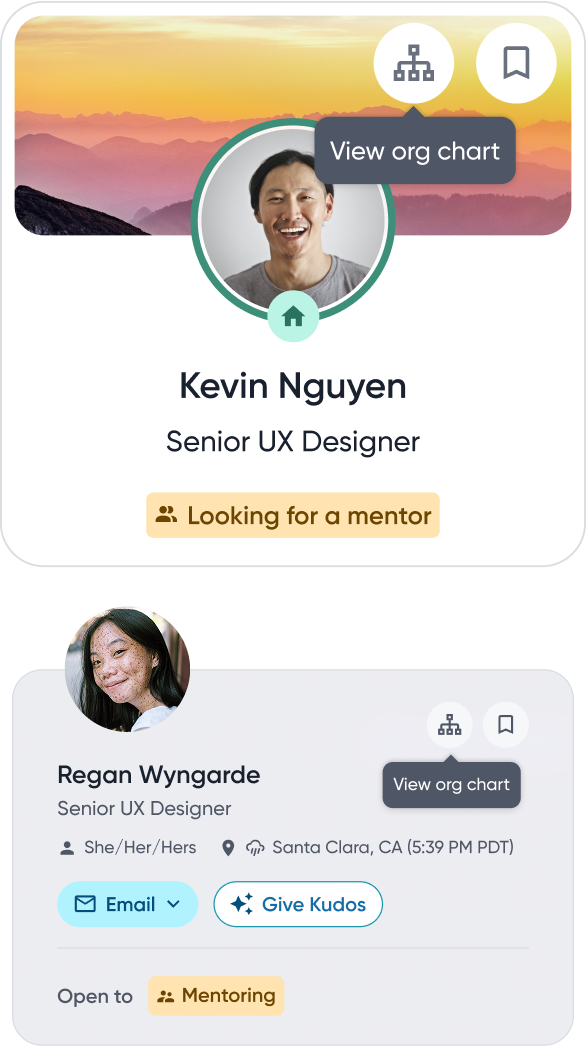
People card
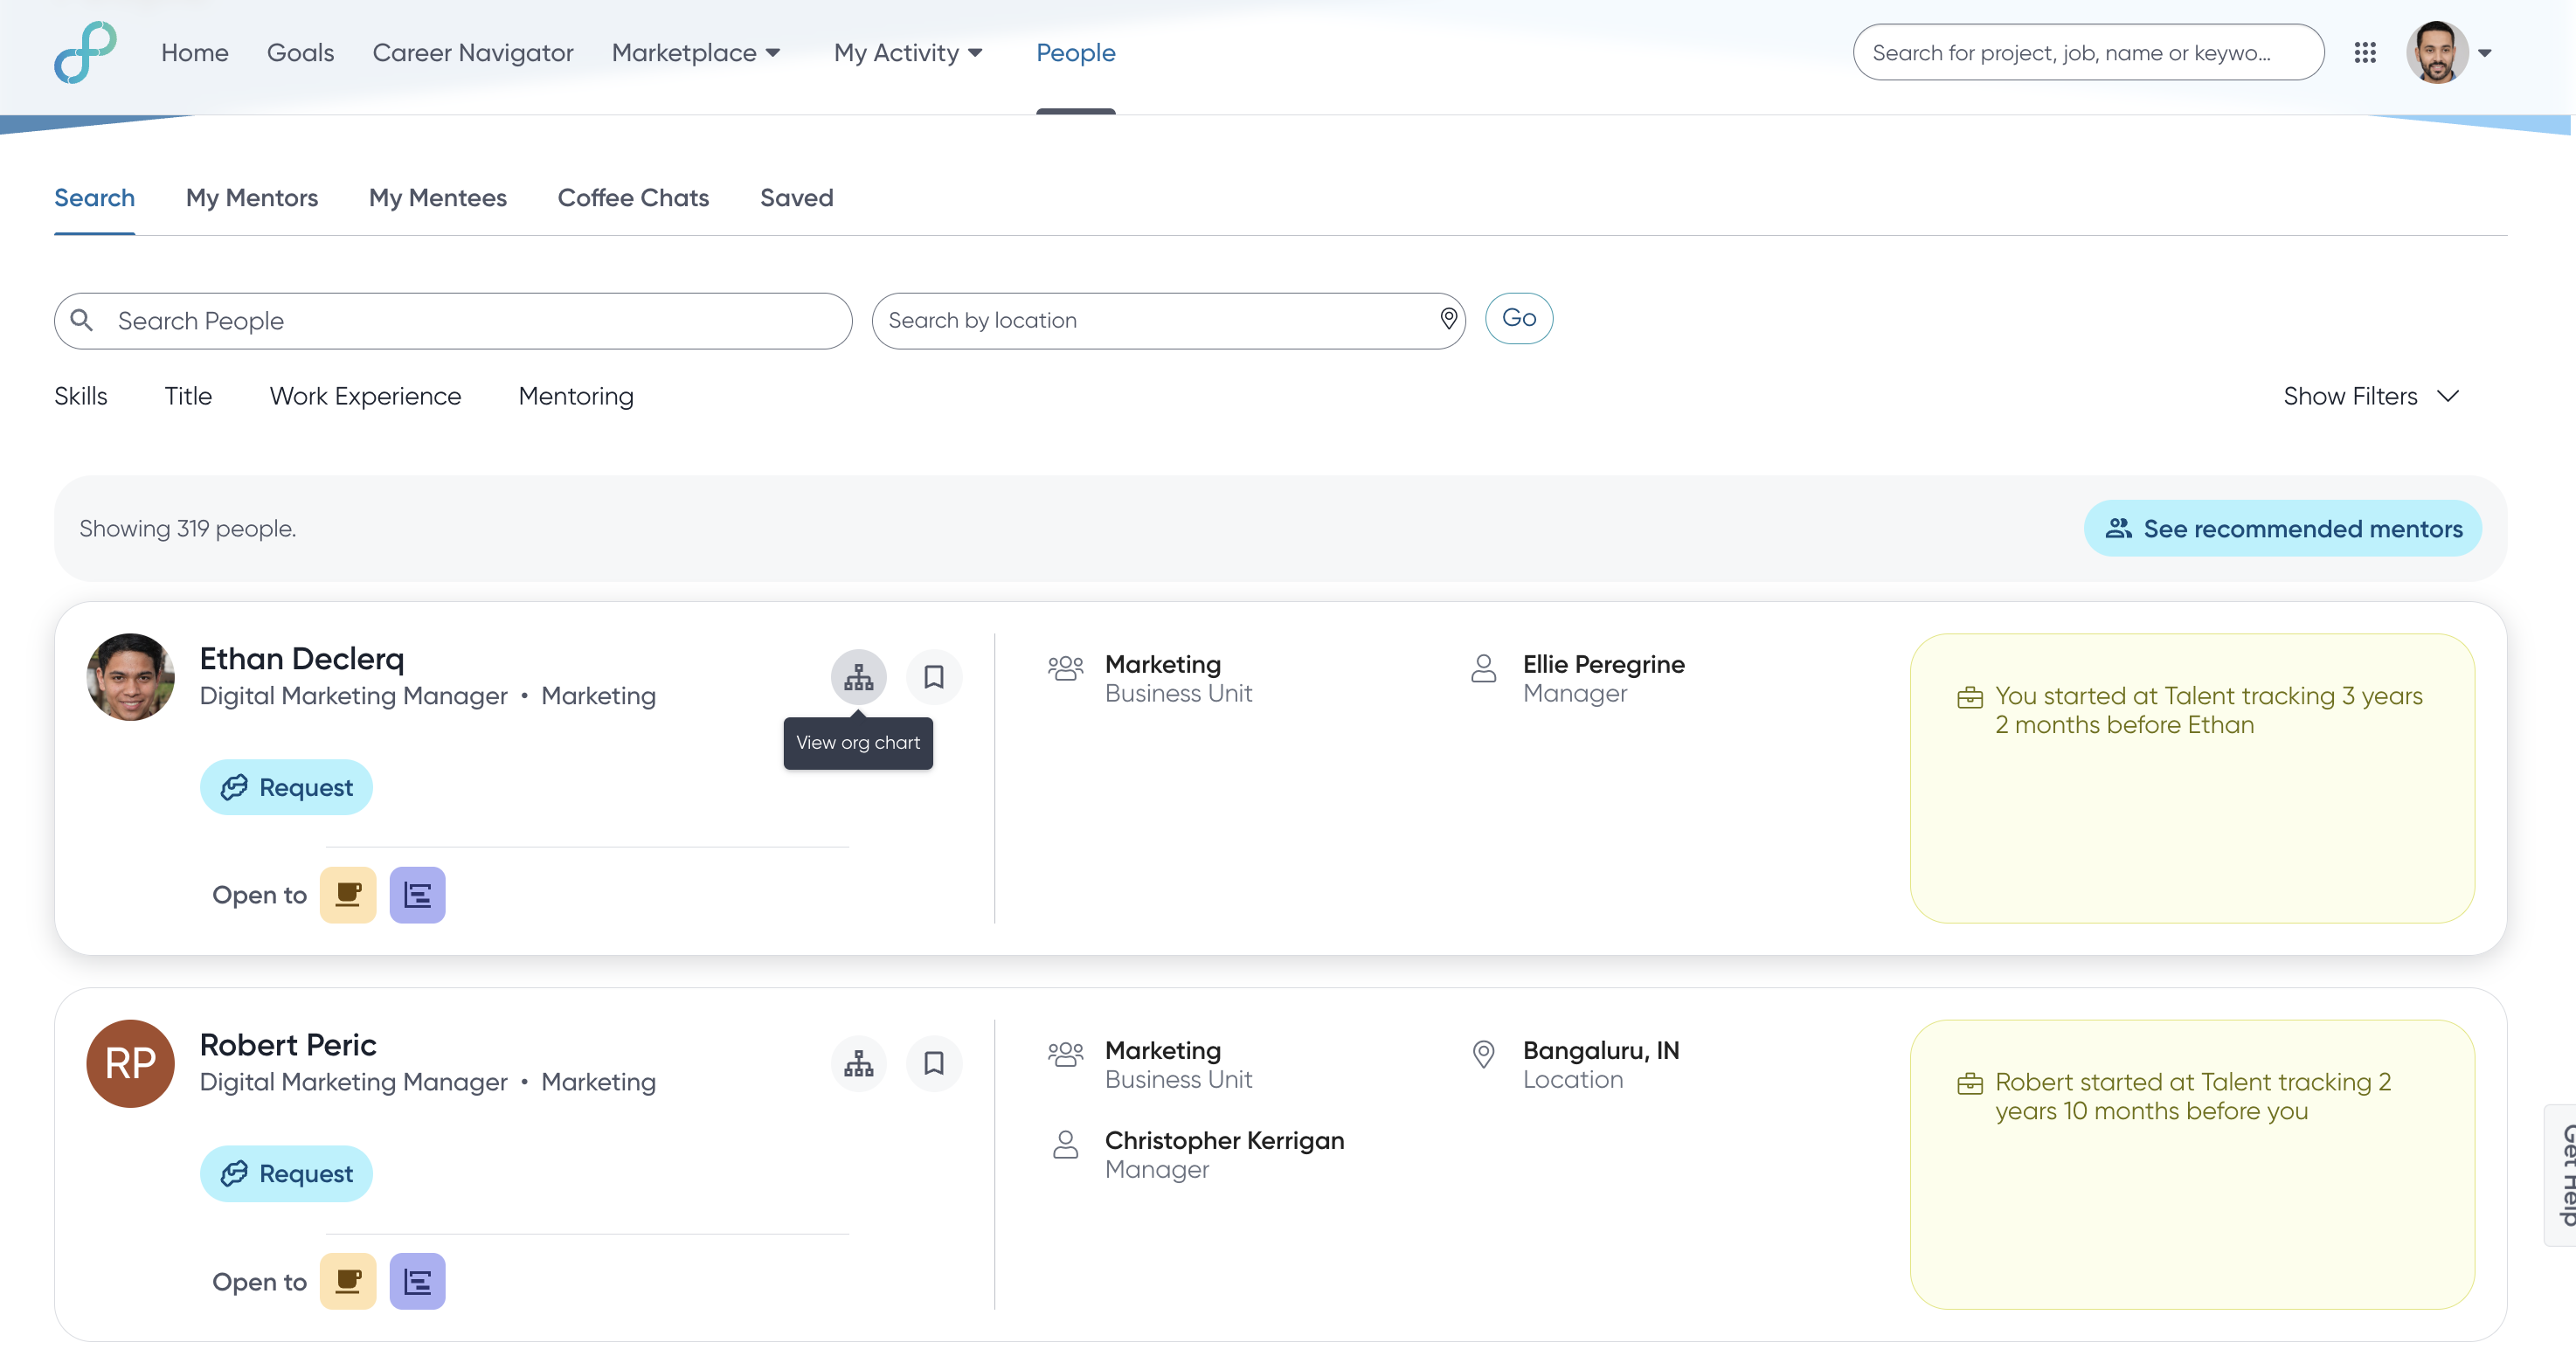
Search results
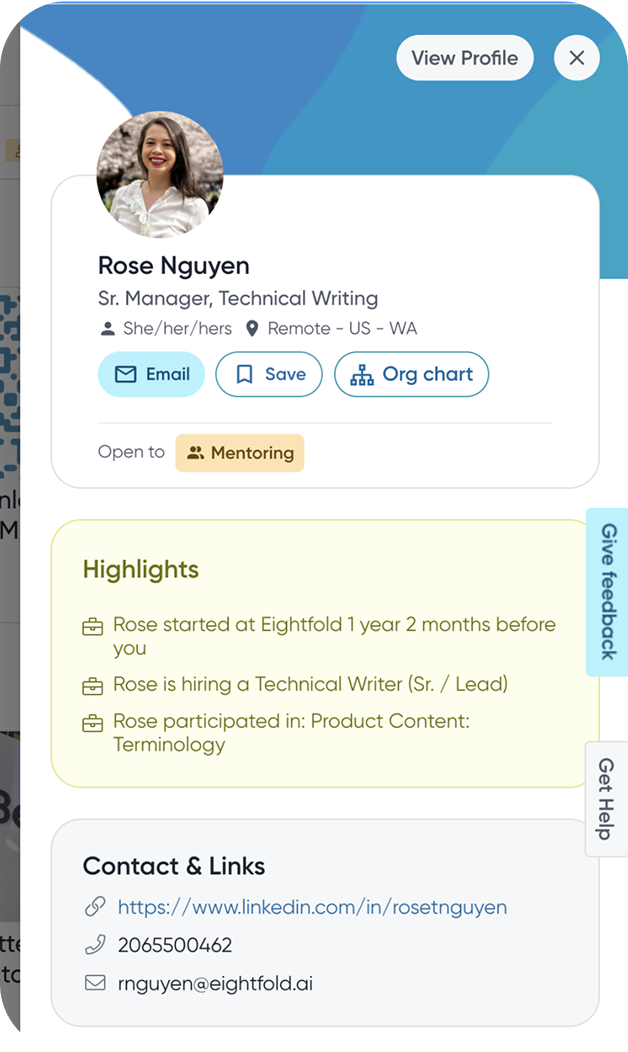
Mini profile panel
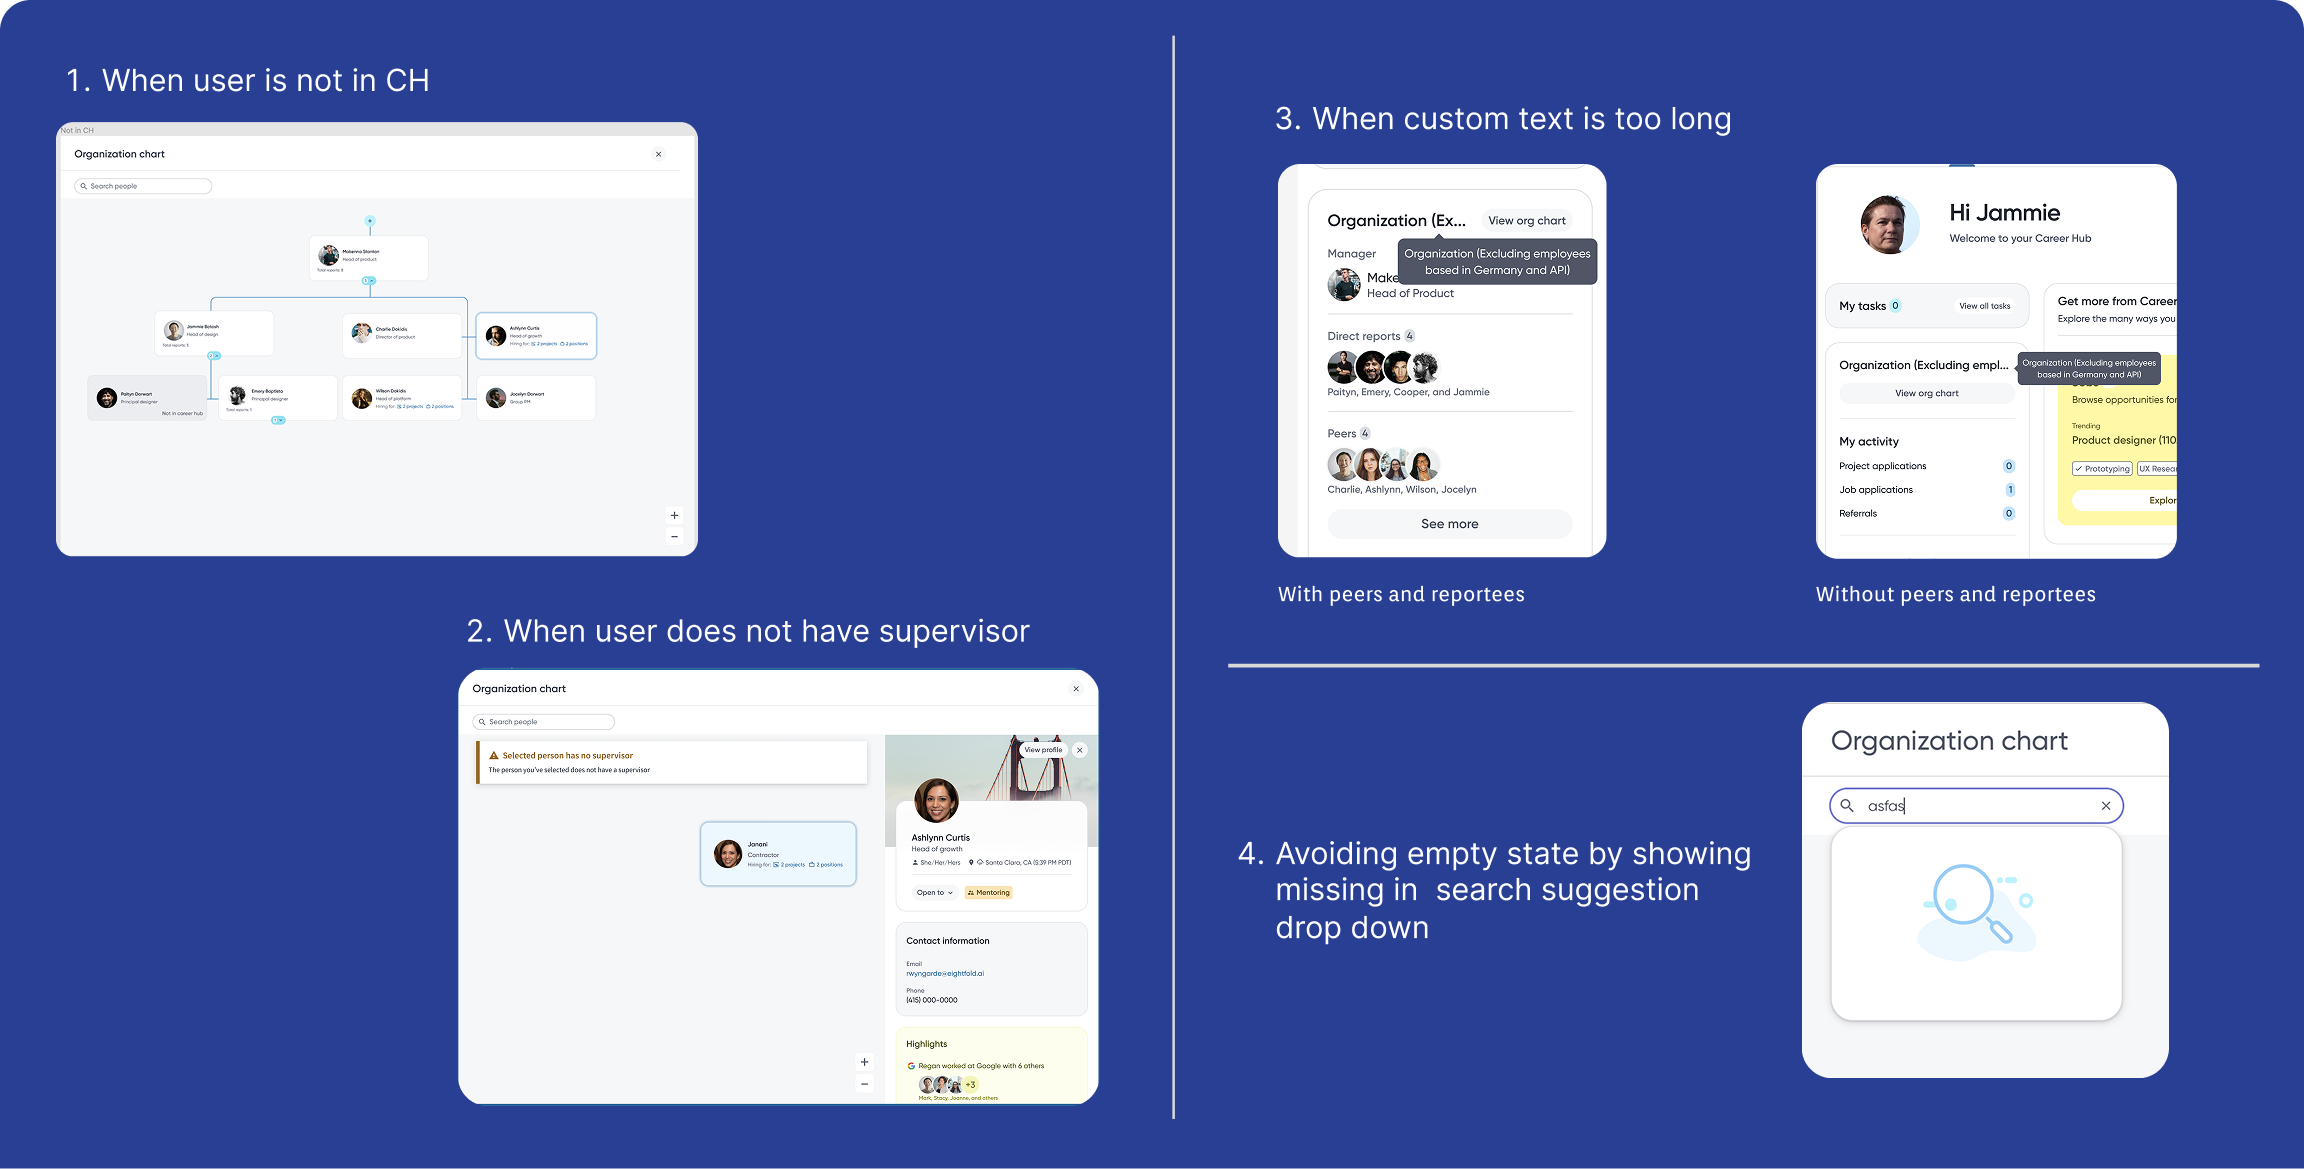
Edge cases
Designing beyond the happy path
No manager
Very large teams
Long names
Empty search results
User outside the hierarchy
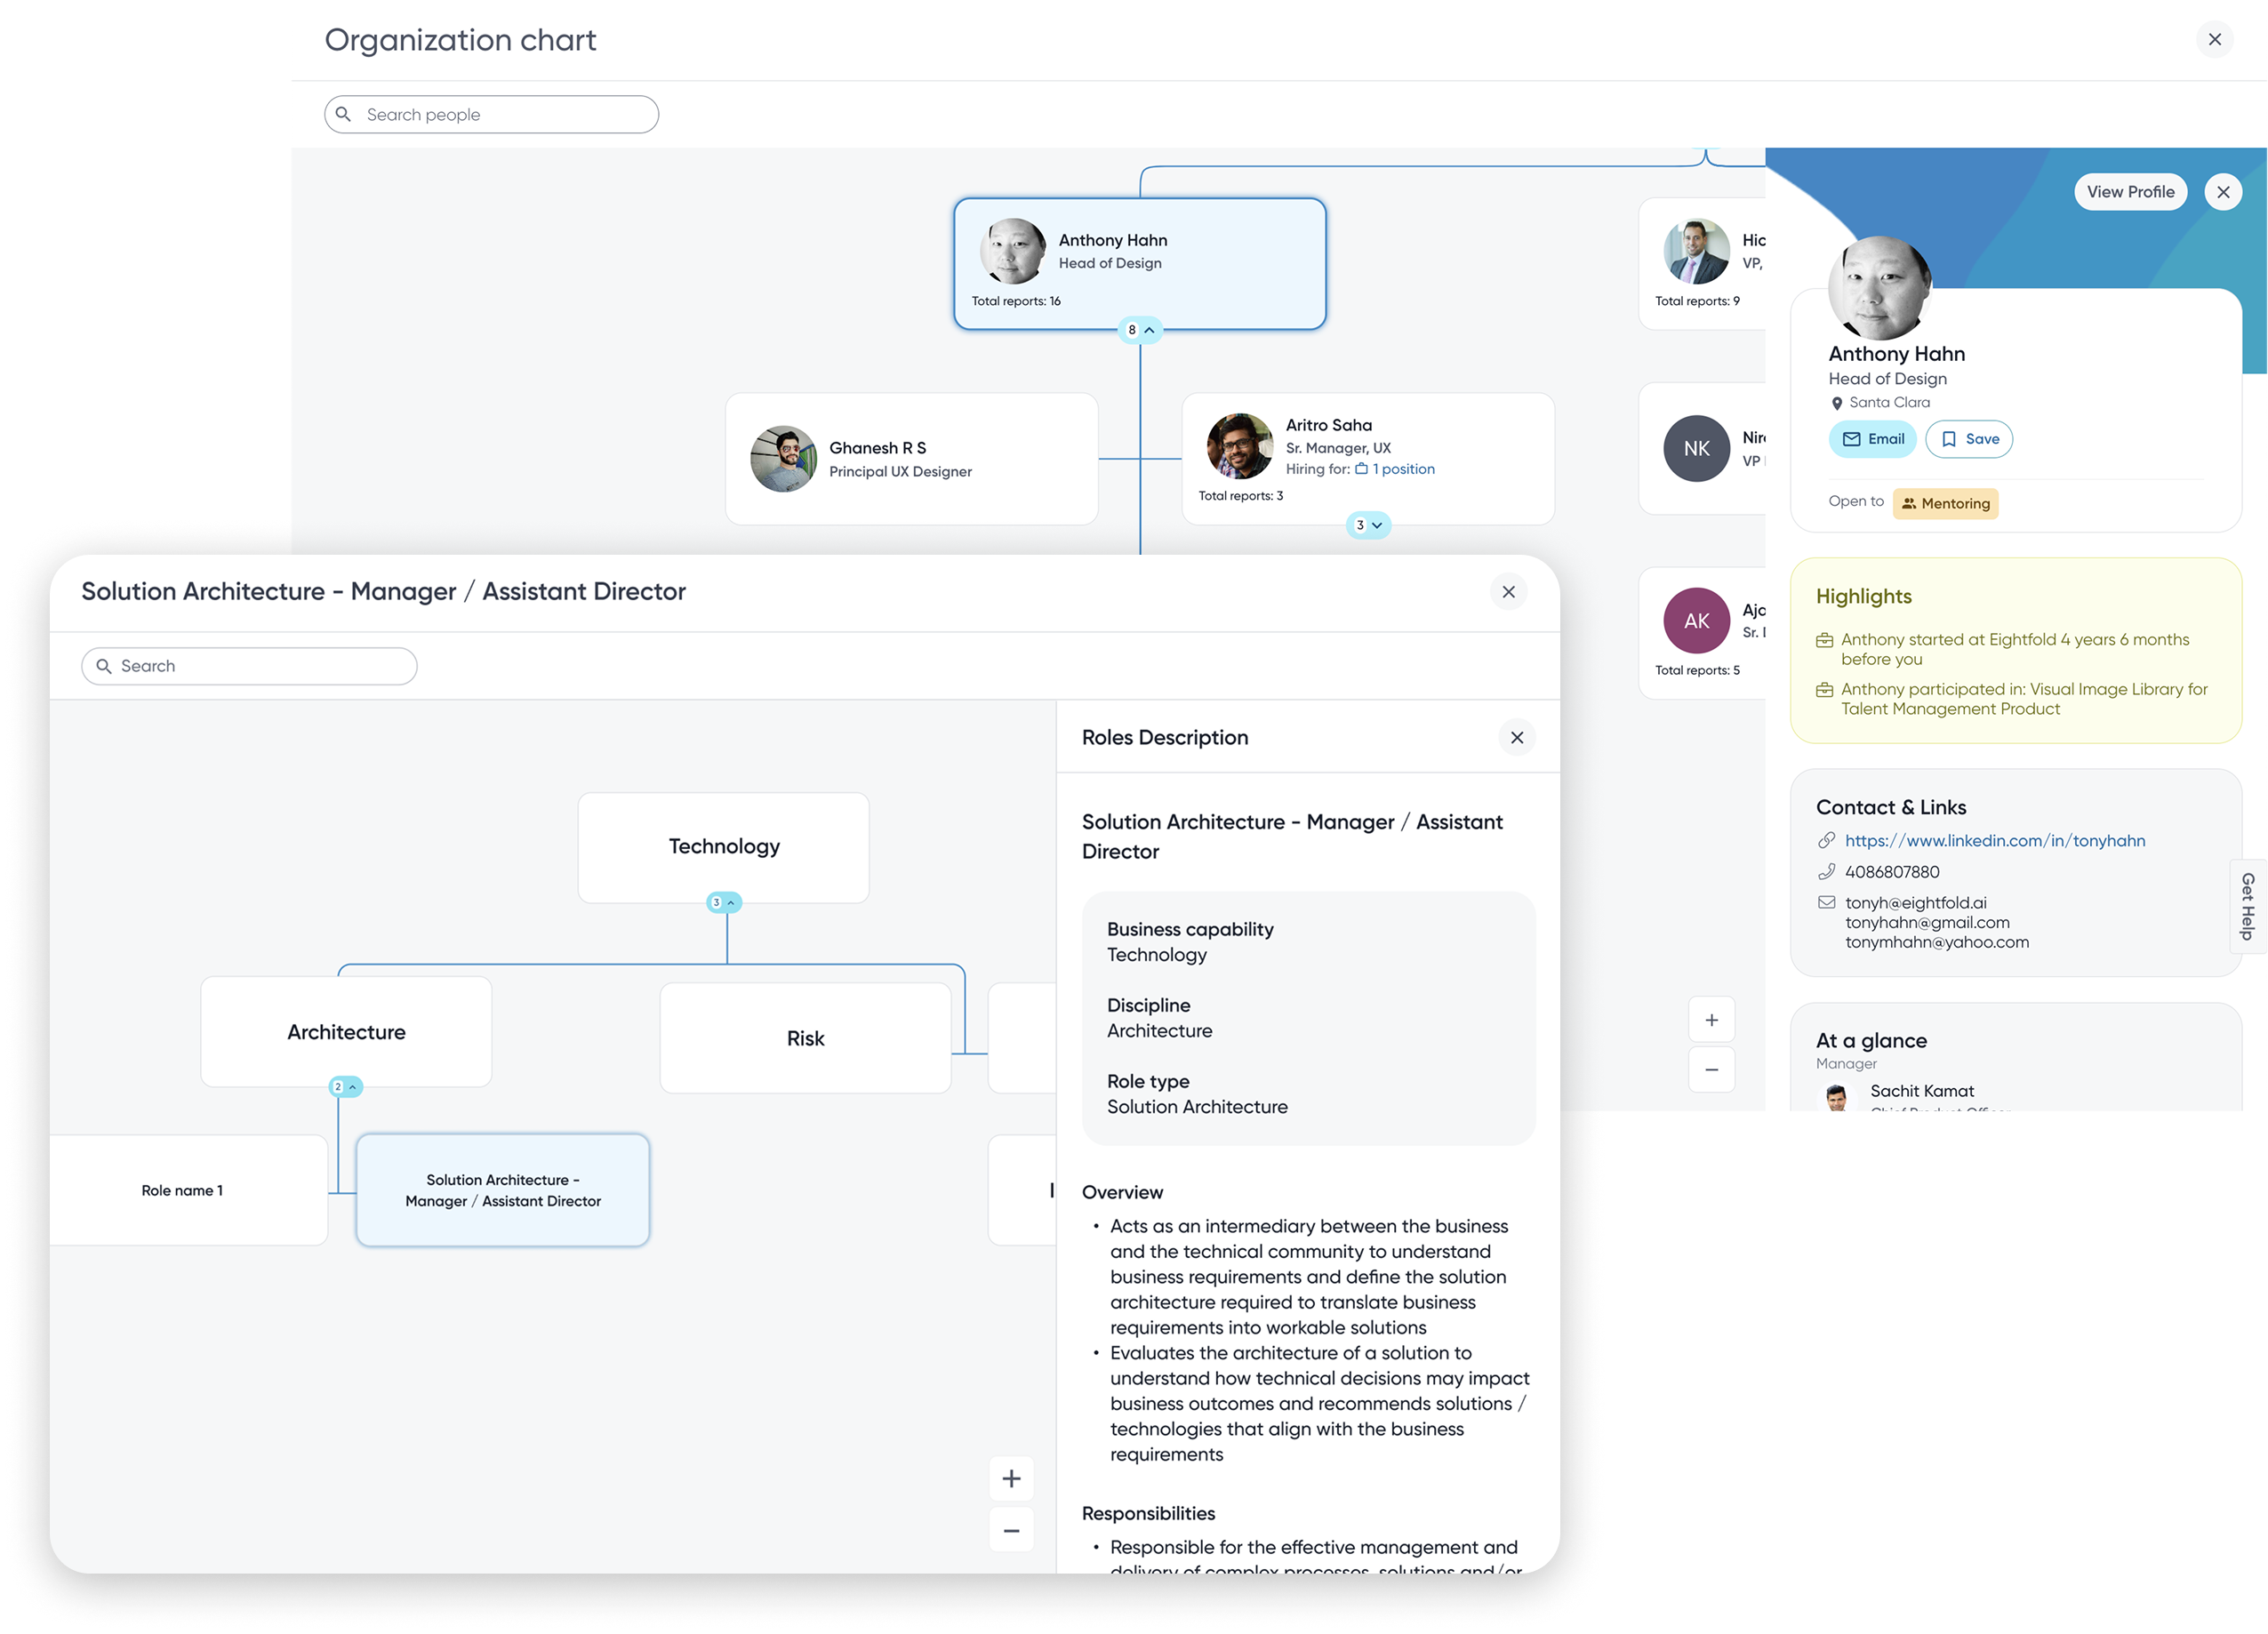
Design system evolution
From one feature to a platform capability
Org Chart
The side panel was built so people keep their place.
↓
Design system component
Made reusable with the design system team.
↓
Role Architecture
A tree of roles. Click a role and the same panel shows its details, without leaving the tree.
↓
Admin · Mentorship · Kudos
Reused it for the same need: context without losing your place.
Impact highlights (6 weeks post-launch)
From a hidden popup to Career Hub's most used feature
Number of visits since launch
500%
Before: under 5% monthly use · 65% bounced · 20 s average visit
• CTR jumped from 9.1% → 29.4%
• Avg. session time grew 28s → 1m15s
• 15% more bookmark adds
• 11% more profile updates
Note: Metrics tracked via internal dashboards (Mixpanel), in-app events, clickstream data, and daily active usage logs post-launch.
👍 Positive feedback
"I love how easily I can navigate the large org charts now. It's so much smoother and more intuitive than before." EY customer
✨ Usability
"I'm impressed with how user-friendly the org chart is. It's straightforward and easy to understand, even for a first-time user." EF New hire
👥 Engagement
"I find myself using the org chart almost every day now for various tasks. It's really improved how we collaborate and keep our profiles updated." Amgen user
BEYOND THE MVP
Designing with the future in mind
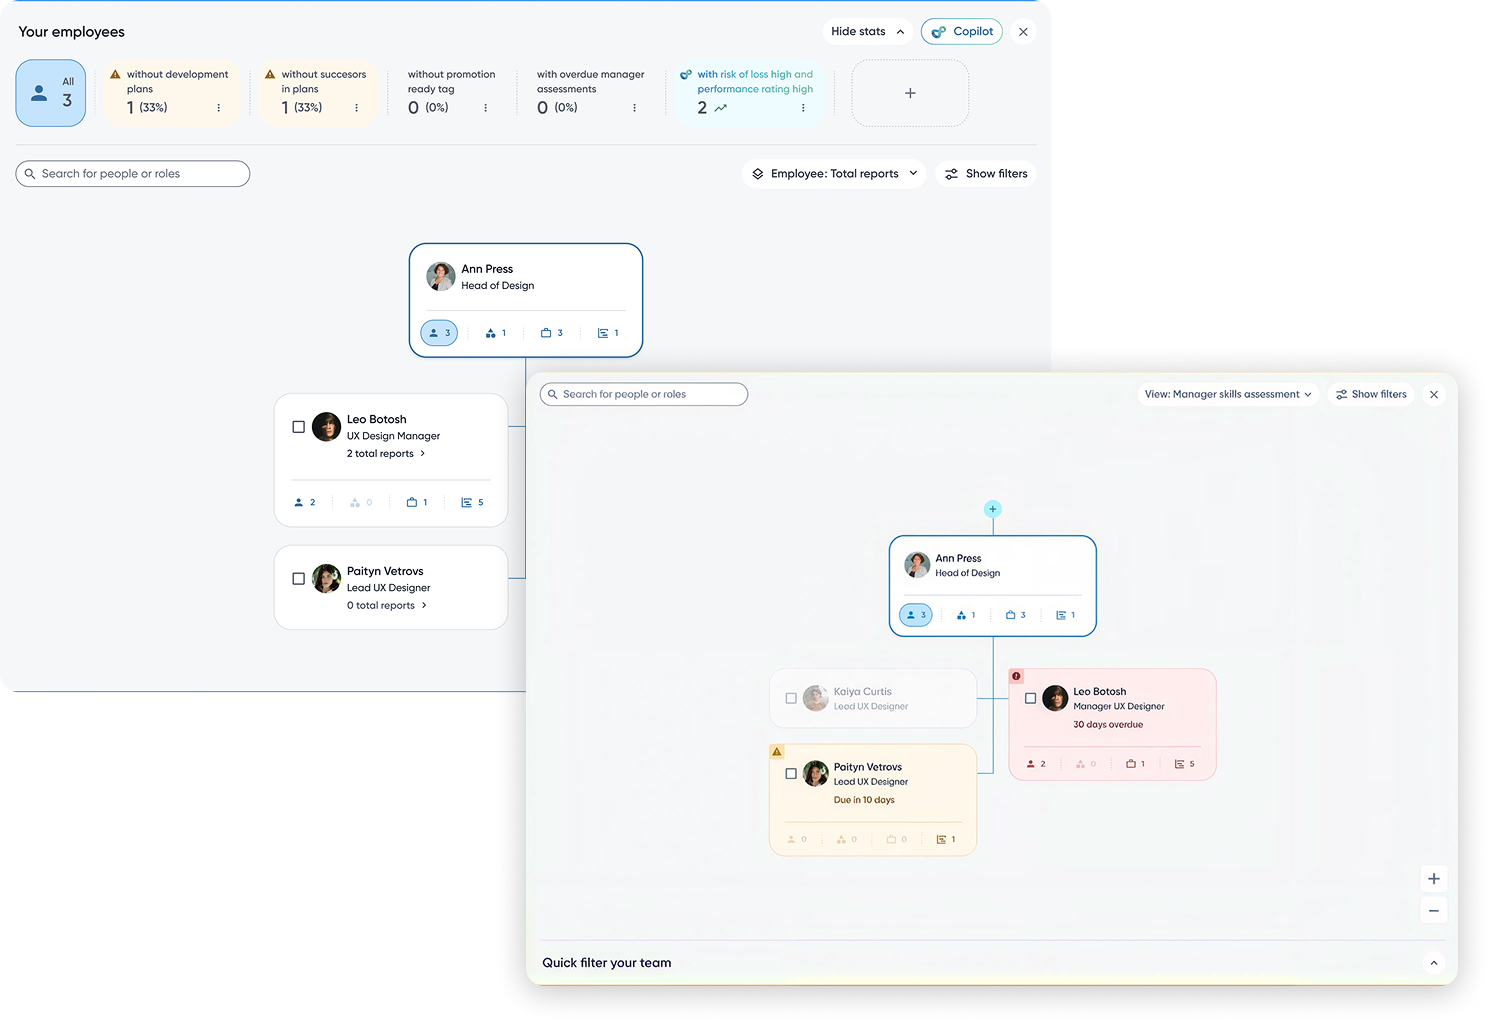
Manager & HRBP view
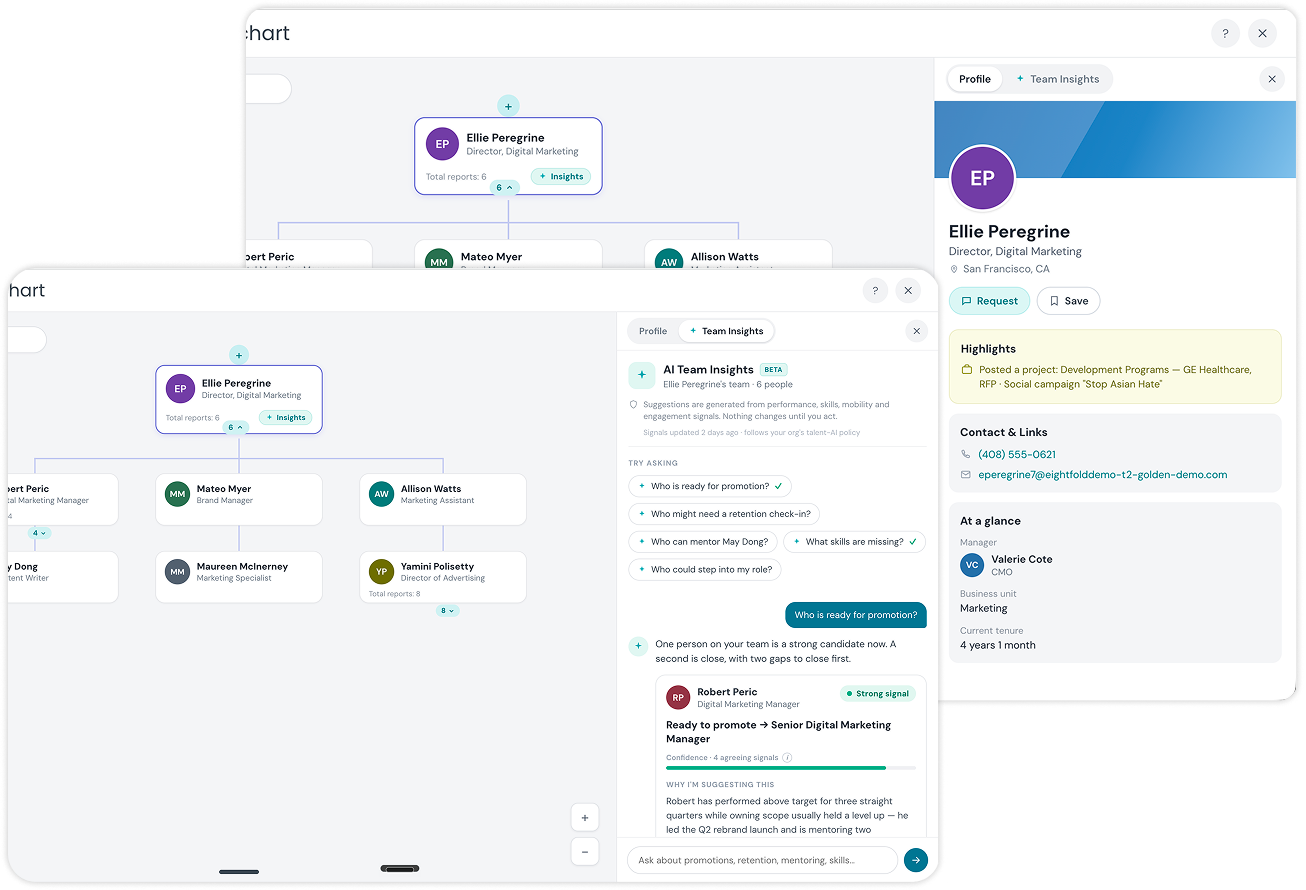
AI Copilot
Real roadmap, from the BRD
Fast follow: custom views & filters, deeper CareerHub integrations. Explicitly out of scope: mobile org chart, to keep the MVP lean.
Prioritization, made visible
What we chose not to build, and why
Full inline profile detail
Deferred, moved to on-demand mini profile after render-cost benchmarking.
Freeform custom views per team
Fast-follow, generalized into a reusable side-panel component, not a one-off.
Org-wide instant search
Scoped instead, kept hierarchy visible so people never lost their place.
Mobile org chart
Explicitly out of scope, usage patterns didn't justify it for this release.
Not gaps, trade-offs made on purpose, with a reason attached to each one.
Looking back
If I were solving this today
I'd redesign how people find people, not the Org Chart. The chart becomes one view inside a richer people graph.
Organization map. The old tree, kept as one lens.
People graph. Skills, projects and relationships, not just reporting lines.
Semantic search. "Who's worked on enterprise onboarding?"
AI discovery. Suggests the right connection before you search.
Skills graph. Mentors and moves matched to real work, not titles.
Cross-team visibility. One team's constraints made clear to another.
Where I'd take this next
An AI-first vision for employee discovery
AI org overview
Reads structure and health like a good HRBP.
Team health and risk
Early signs of attrition.
Skill gaps
Capability vs. need, for leaders.
Internal mobility
Roles recommended, not searched for.
Mentor discovery
Matched on real work, not titles.
Relationship graph
Who actually works with whom.
Ask in plain words
"Who should I loop in on this?"
Succession planning
Same graph, not a spreadsheet.
Concept · not built
✦ Who should I loop in on the onboarding redesign?
Suggested from shared projects, skills and recent work:
A product designer, onboarding team
Worked on the last onboarding project
An engineering manager, identity team
Owns the sign-up service
A content designer
Wrote the current onboarding copy
Open in Org ChartWhy these people?
One graph underneath everything, not a pile of point features.
Reflection
What this project taught me
01
Design for the platform, not just the feature
The biggest win wasn't the Org Chart itself, it was creating a reusable interaction pattern other teams could build on.
02
Constraints can lead to better solutions
Engineering constraints pushed us toward a more simpler & scalable experience instead of a more complex solution.
03
The best products are built together
The strongest ideas came from close collaboration across Product, Engineering, Research, Content and Design Systems.
Thank you.
I'm happy to dive deeper into any aspect of the project.
Appendix
Backup material
Deeper detail on research, competitors, rejected directions, trade-offs and metrics, for follow-up questions only.
Appendix · Research Deep Dive
How we built conviction before designing
Research methods
Mixed-method: analytics review, moderated interviews, usability testing on prototypes.
UX Research collaboration
Partnered with UX Research from framing through synthesis, not brought in after the fact.
Product analytics
Usage data showed Org Chart was a hidden, rarely-returned-to feature with high drop-off per click.
Customer interviews
Employees and managers across EY, Amgen and EF walked us through real tasks, not opinions.
Research synthesis
Shared affinity mapping with Product and Research turned raw notes into a single problem framing.
Key insight
Employees weren't after reporting lines, they wanted "who do I work with, who's hiring, who can help me."
Appendix · Jobs To Be Done
Mapping personas to goals
Employee
Goal
Understand org structure and connect with key teammates.
Pain point
No search, no context, every click left the page.
Expected outcome
Find anyone instantly, see enough to act, without losing place.
Manager
Goal
Keep team structure and roles accurate and visible.
Pain point
No dedicated team view, no way to act on what they saw.
Expected outcome
Team-scoped insight and light-touch actions from the same view.
HRBP
Goal
Complete, reliable view to support planning and development.
Pain point
Data too shallow and structure too rigid for workforce planning.
Expected outcome
Deeper context on demand without slowing the org-wide view.
Appendix · Competitive Analysis
What we learned, not a feature checklist
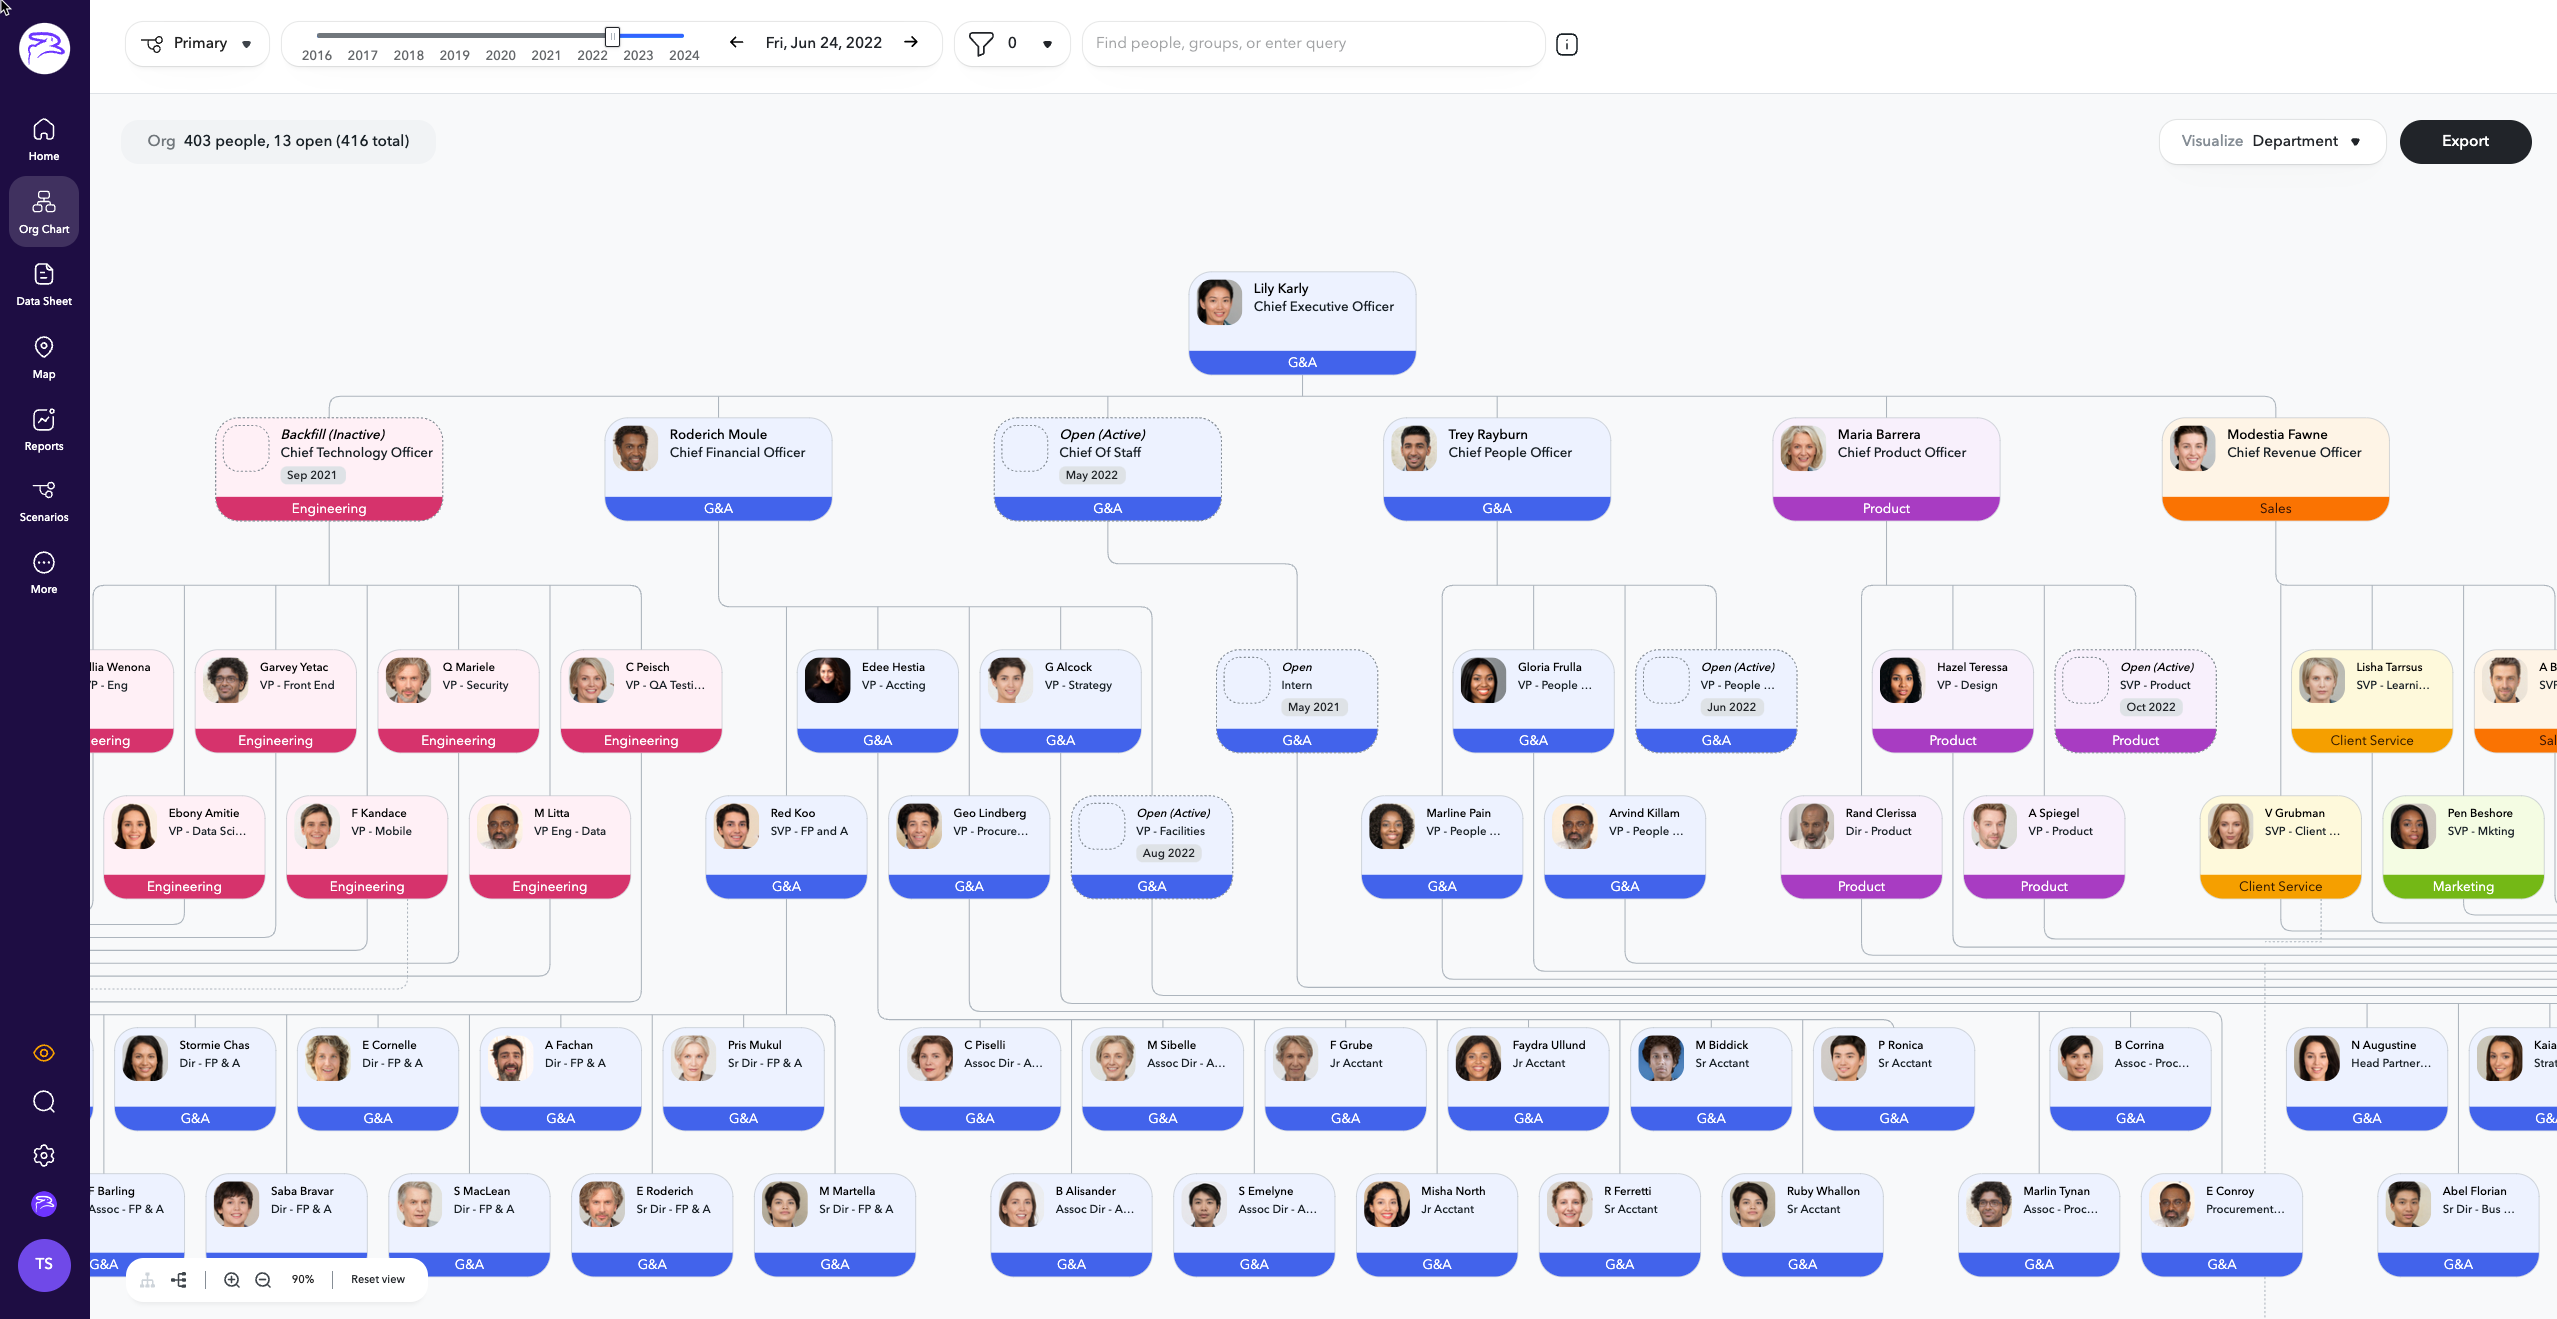
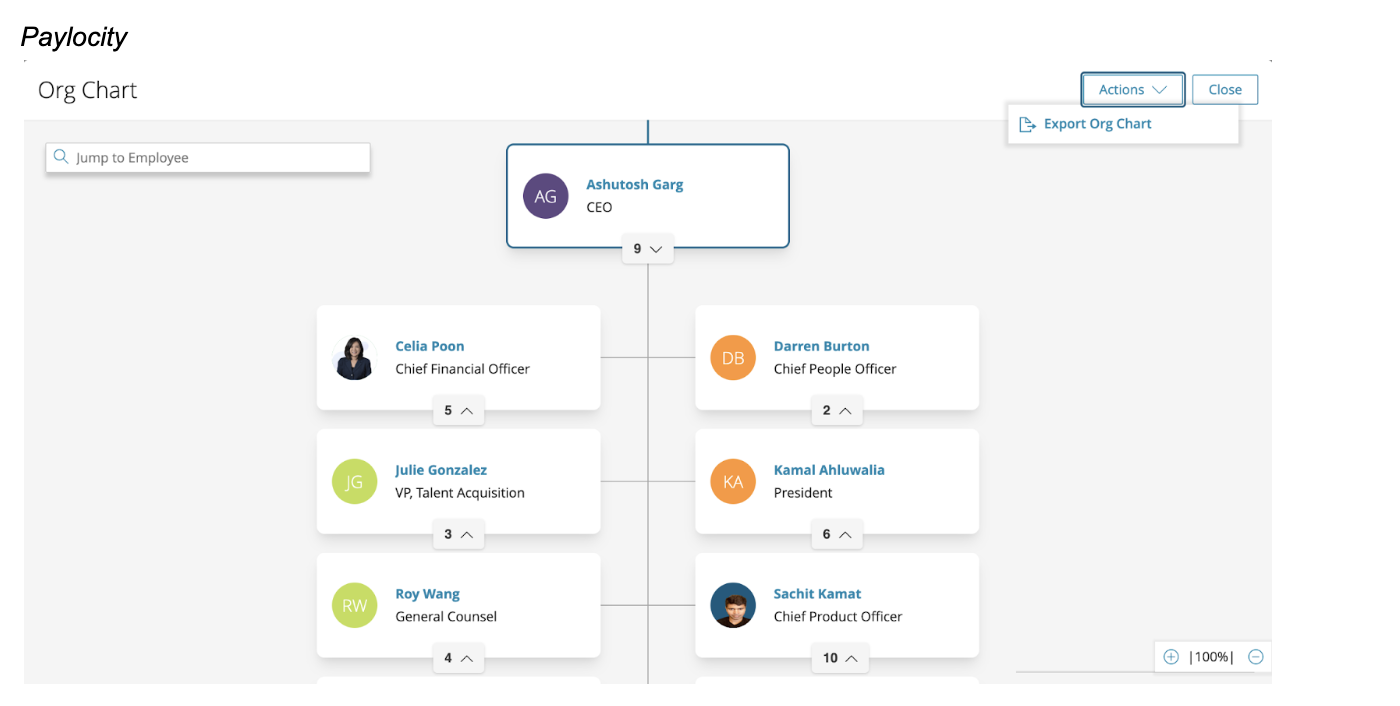
Reviewed
Workday, Darwinbox, ChartHop, Paylocity, Gloat, plus Ancestry & Ackmee for visual references.
What we learned
Progressive disclosure, custom views by role, and self-service profile updates all reduce friction at scale.
What we avoided copying
Dense HR-tool dashboards and heavy customization frameworks that don't fit how Career Hub is actually used.
What influenced our thinking
Rich-but-optional profile data and responsive layouts that hold up across devices and org sizes.
Appendix · Design Exploration
Four directions considered before full screen won
Popup
Rejected, still too shallow, broke flow on every click.
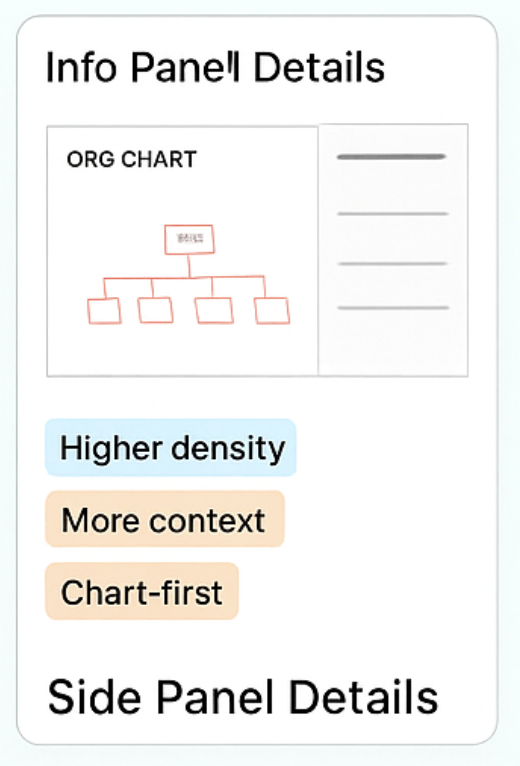
Side panel
Rejected, competed with hierarchy for space on wide trees.
Sliding drawer
Rejected, extra motion cost without added clarity.
Full screen, shipped
Hierarchy and rich context coexist; scales to enterprise orgs.
Appendix · Engineering Trade-offs
Decision matrix: vision, constraint, response, outcome
Original vision
Engineering concern
Design response
Final outcome
Full profile detail inline on every card
Render/payload cost at 10k+ employee orgs
Detail moved to on-demand mini profile
Lightweight cards, full context one click away
Freeform custom views per team
Rigid design system constrained layout flexibility
Generalized into a reusable side-panel component
Pattern reused across Career Hub tools
Instant org-wide search everywhere
Slow performance on very large orgs
Scoped search, hierarchy stays visible
Fast navigation without losing your place
Appendix · Success Metrics
How success was actually measured
North Star
Broader Career Hub engagement, not Org Chart usage alone.
Leading indicators
Click-through rate, average session time.
Success metrics (6wk)
500% visit growth, CTR 9.1%→29.4%.
Downstream signals
Feature adoption, repeat usage, profile exploration.
Known inconsistency & recommendation
The BRD's directional figures ("40% jump," "3.2× engagement") predate launch; the 6-week Mixpanel dashboard reports the measured 500%/29.4% figures above. Treat the Mixpanel post-launch dashboard as the single source of truth, it's measured, not projected.
Appendix · Platform Evolution
From one feature to a reusable platform capability
Design system
Built on Octuple DS, modular, accessible, scalable by default.
Role architecture
One shell, role-aware depth, Employee, Manager and HRBP see different detail from the same pattern.
Reusable interaction pattern
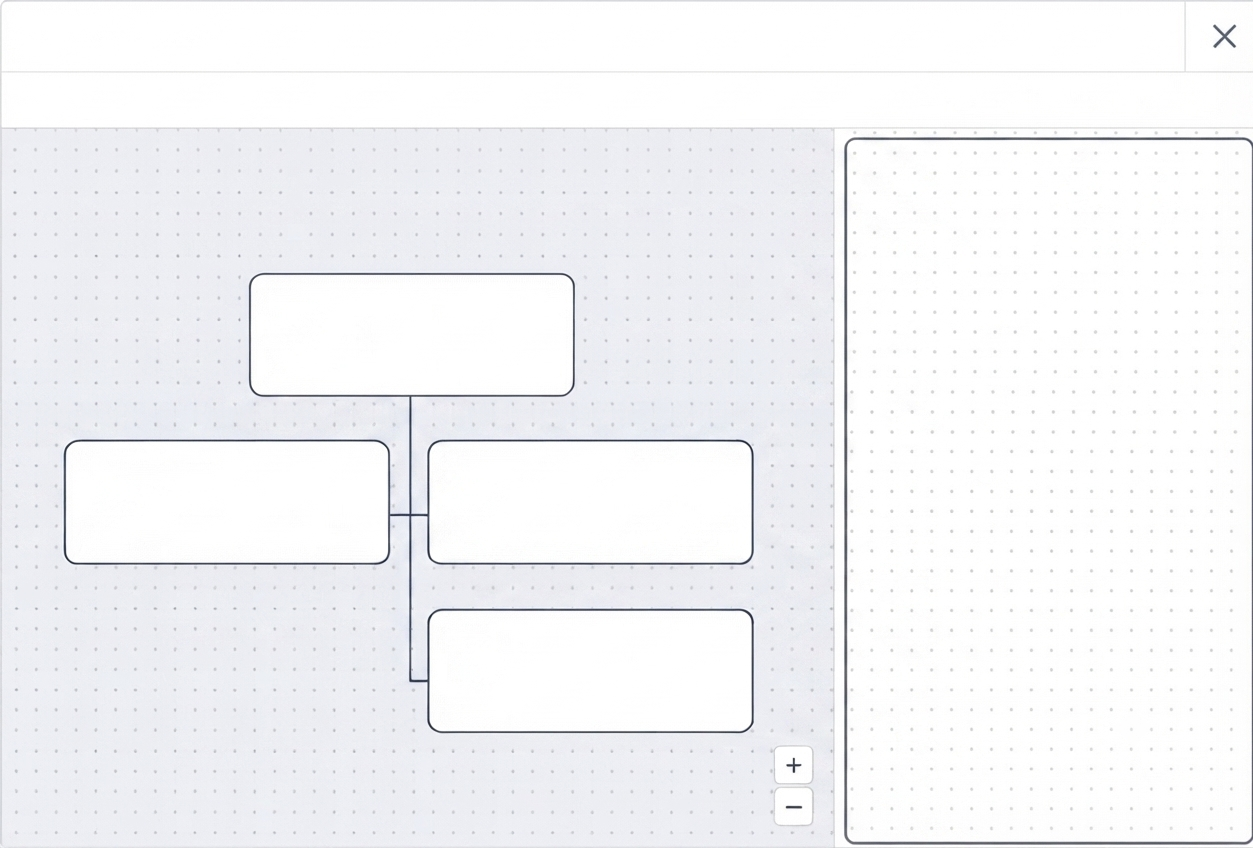
The mini-profile side panel now powers Admin, Mentorship and Kudos.
Why it mattered strategically
One project's ROI now compounds, every future "context without losing your place" need ships faster.
Appendix · Tough Questions (1 of 2)
Questions I've been asked, and how I answer them
"Why present an older project, not your latest work?"
Transparency over spin, chose full ownership over an unfinished outcome.
"Why full screen, not a slide-over?"
Tested against real 10k+ org data; slide-over broke down on wide trees.
"Isn't this a once-a-month tool at best?"
Reframed to daily questions, 500% visit growth is the evidence.
"Why not LinkedIn's People page or filters?"
Real problem was losing context, not finding data, filters don't fix that.
Appendix · Tough Questions (2 of 2)
Conflict, pushback, and self-awareness
"How do you push back when Engineering says no?"
Bring evidence and a working path forward, not just an objection.
"How do you handle Product vs. Engineering disagreement?"
Reframe to the shared goal, and change my own mind when the data says to.
"Why AI, isn't that just a trend?"
Earned after validating the core interaction; one graph, not bolted-on features.
"What would you do differently today?"
Redesign Employee Discovery, not the chart, and push the principles framework earlier.
Appendix · If asked
Why this project, not my latest one
Most recent work
A contract inside an org restructure, PM ownership changed twice, priorities shifted, no stable shipped outcome.
This project instead
Full ownership, start to shipped impact, how I frame problems, negotiate trade-offs, defend a direction.
What stays constant
The UI is a couple years old. The decision-making is how I work today.